12.07.2024
How to create charts with 1001fx
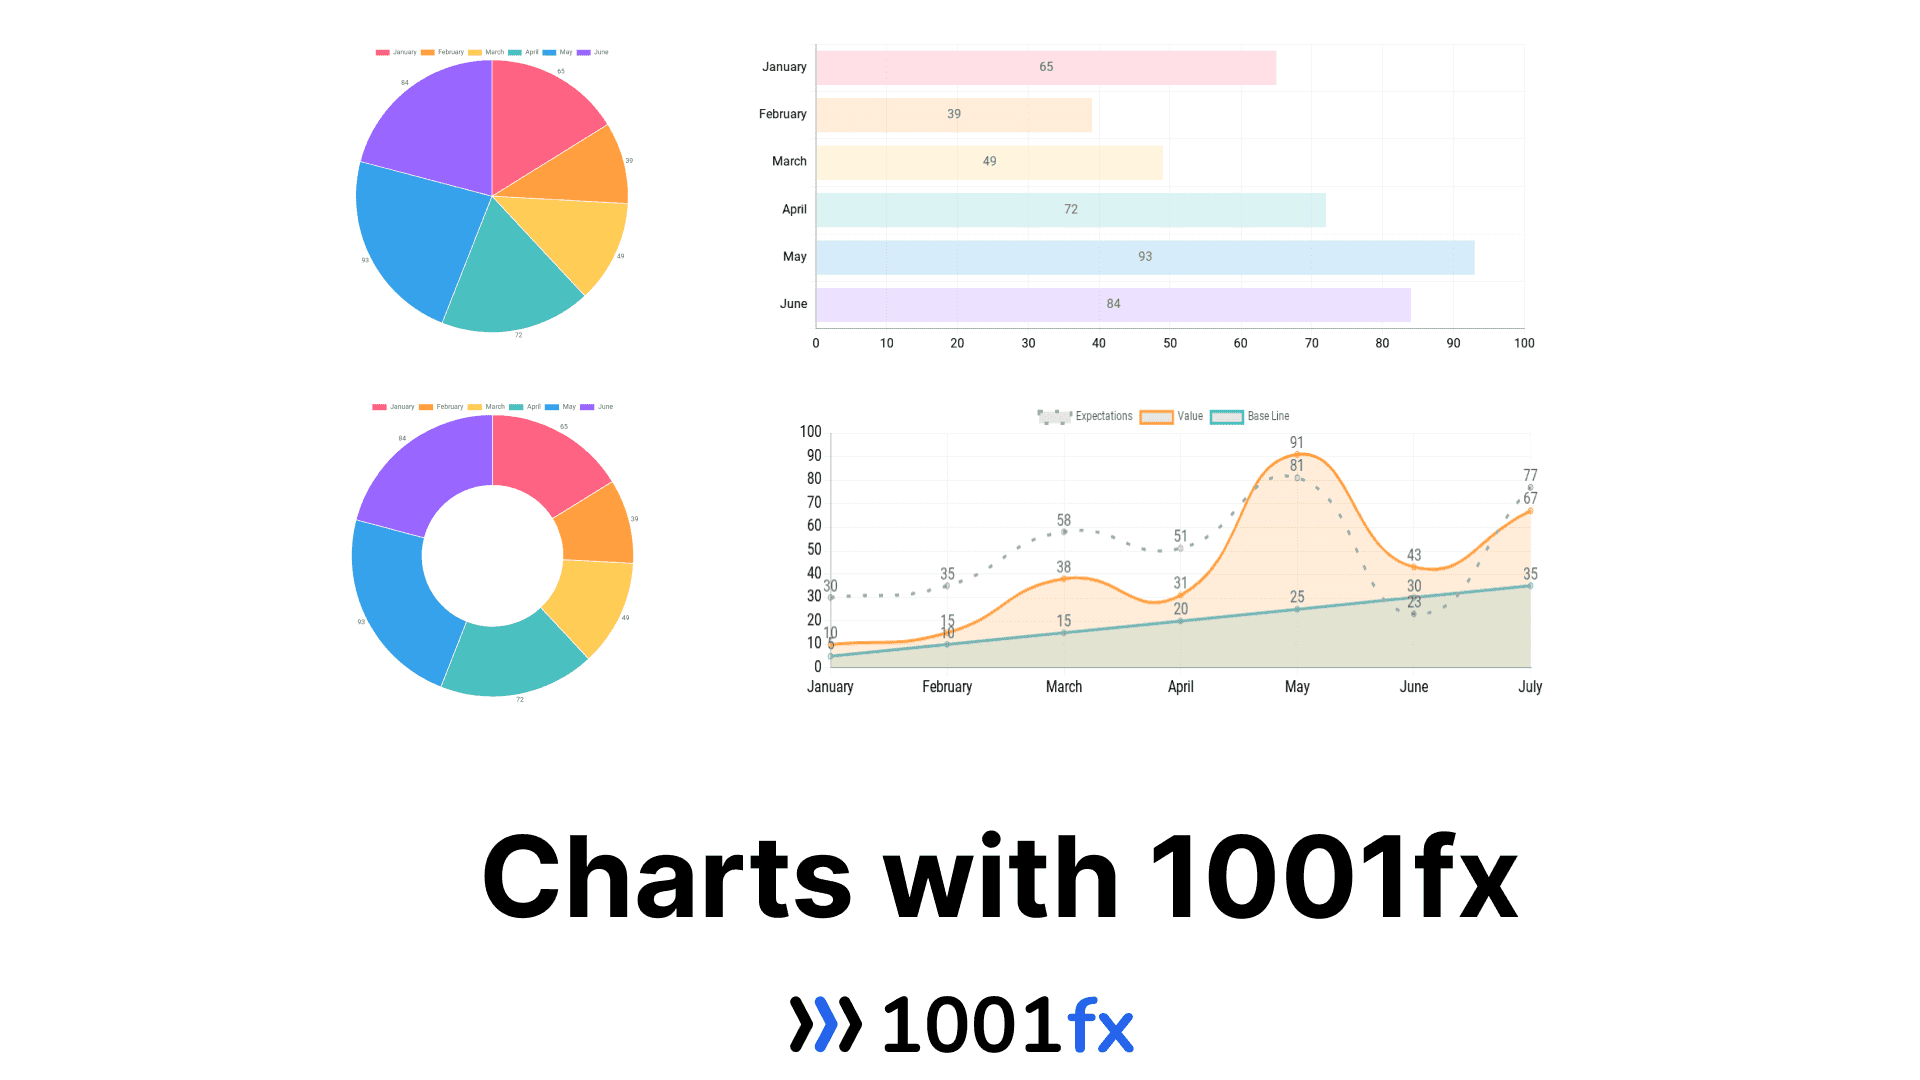
Line, bar, pie and donut charts are easy to create with 1001fx's charting features.
Creating charts is often a complex process, requiring special libraries or a server to generate the charts. Creating charts in nocode automation processes was even more complex. With our 1001fx Line Chart, Bar Chart, Pie Chart and Donut Chart we offer the ability to create charts on the fly in your automation solution.
This blog post shows how to create charts with make.com. Below we also show how to use the api directly via postman or API.
Charts are based on the awesome ChartJs library.
Make Scenario
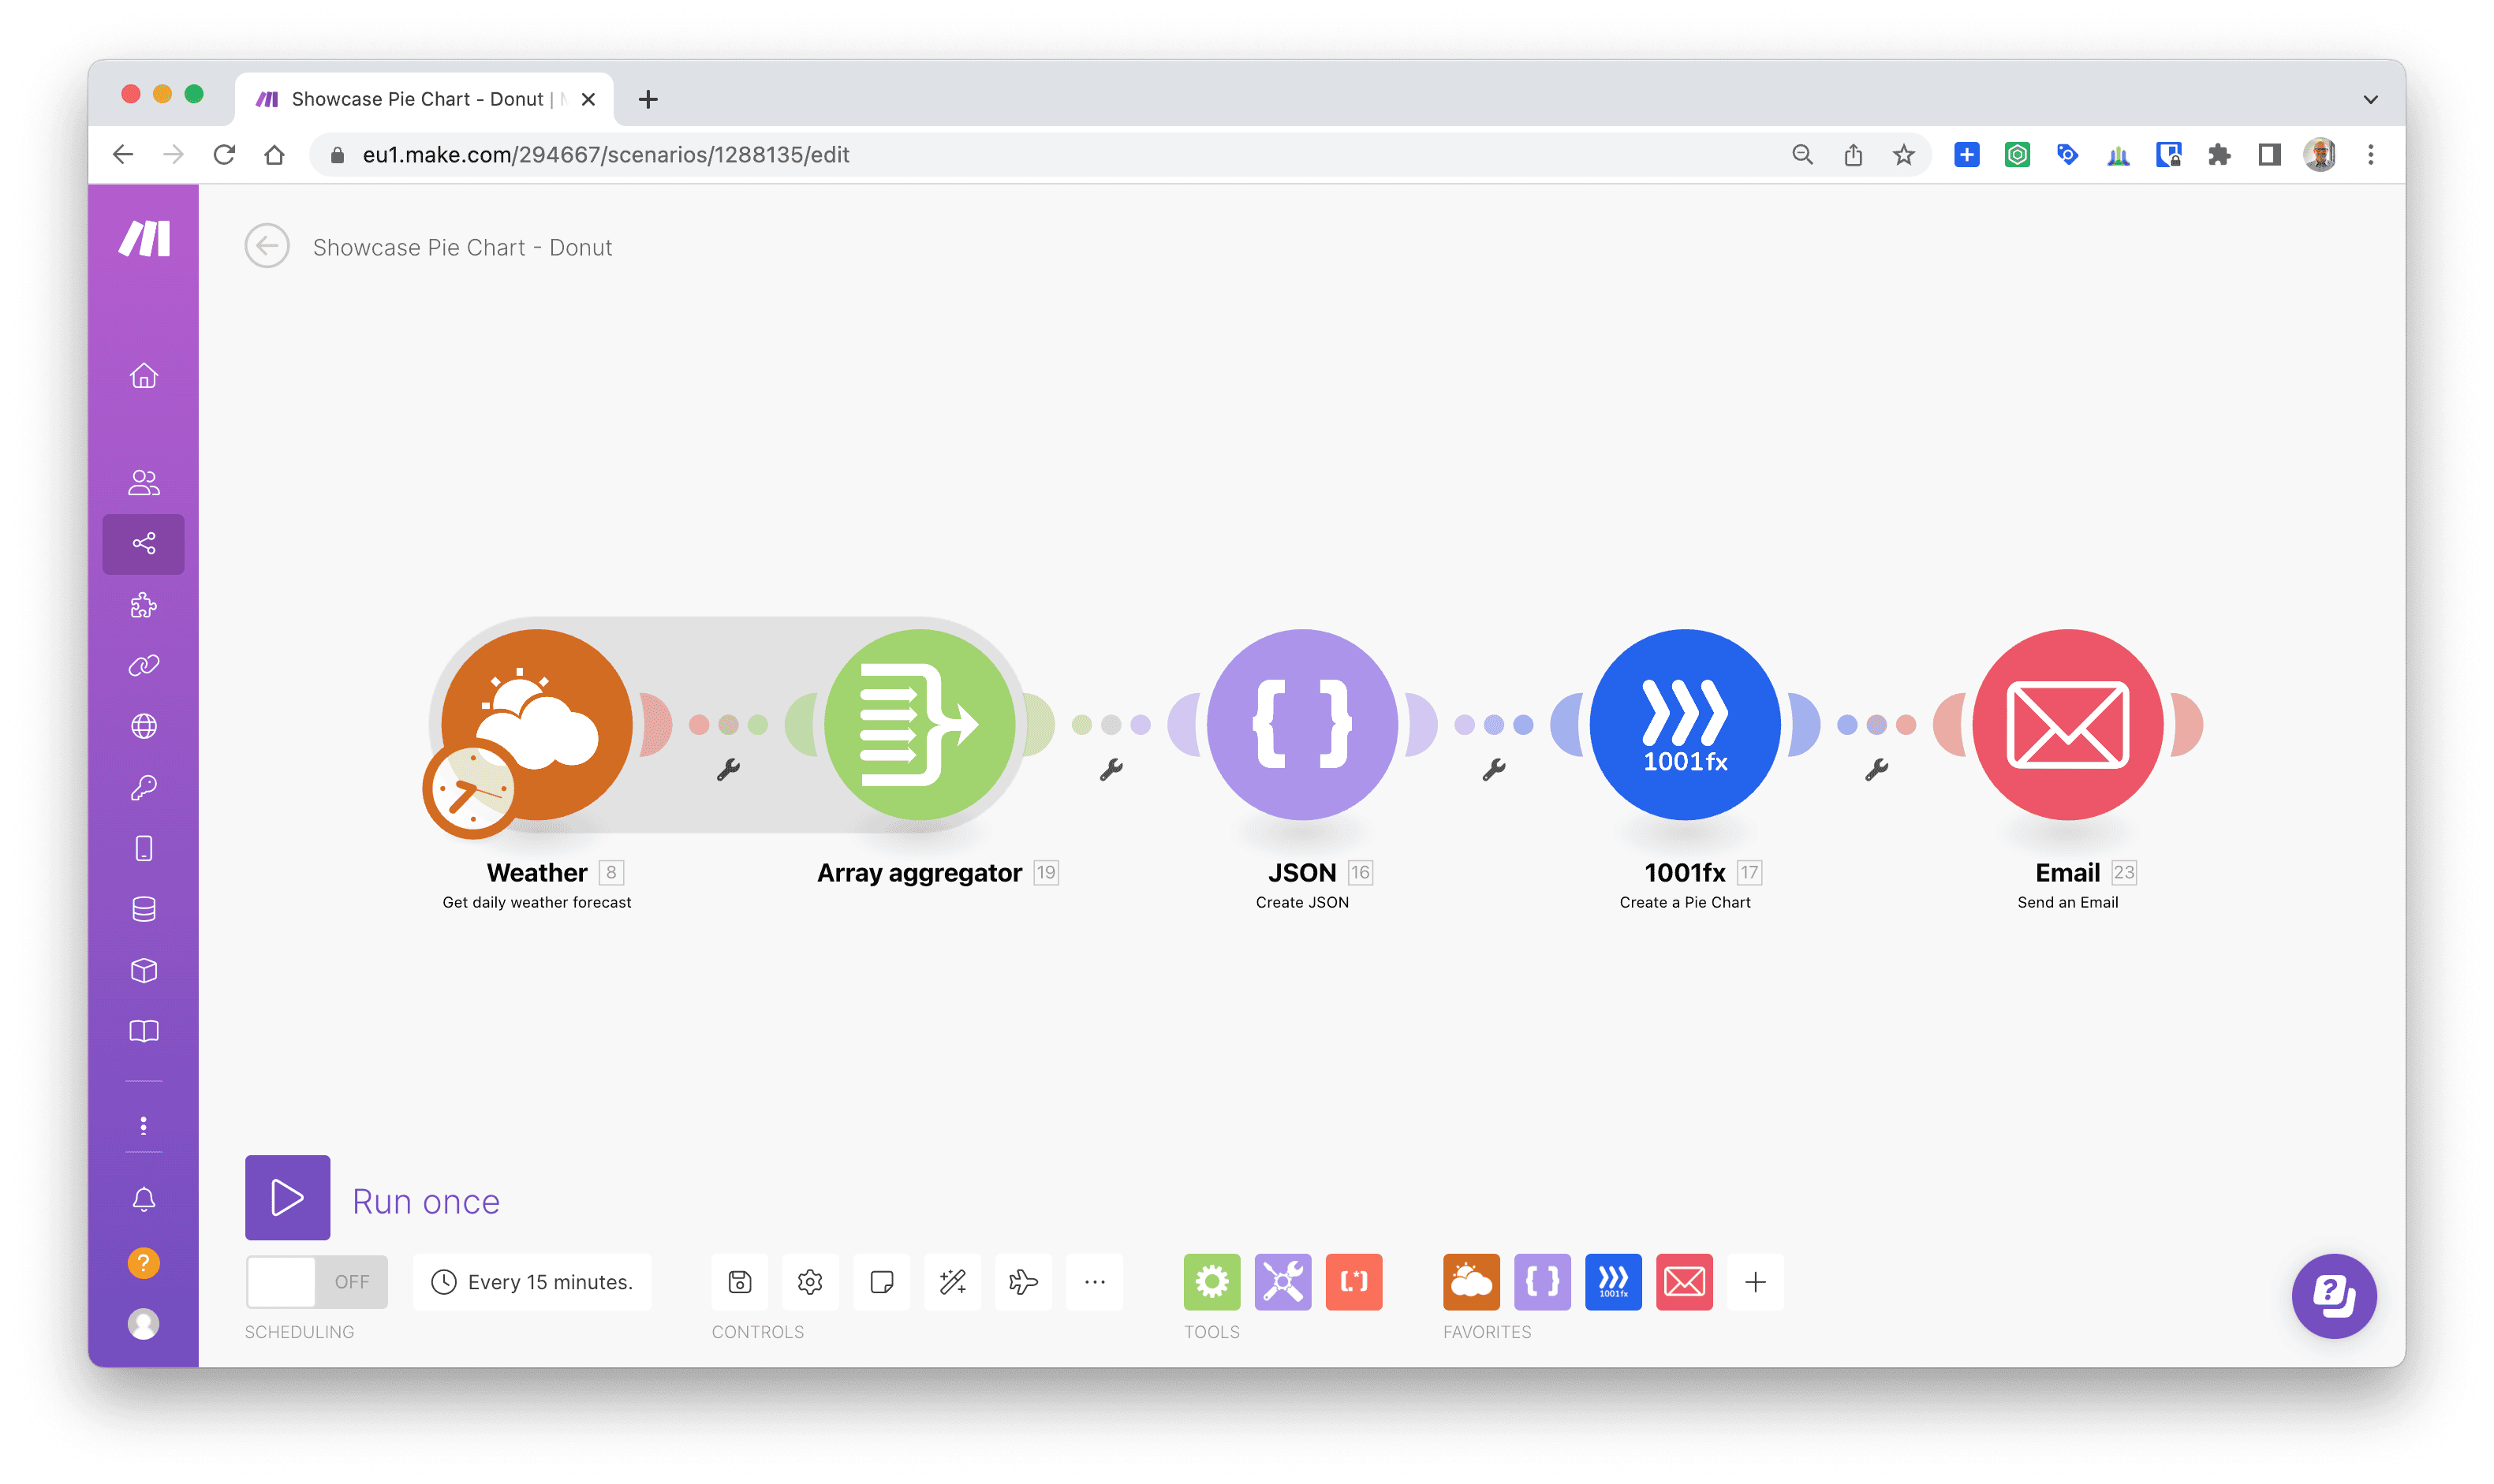
Workflow
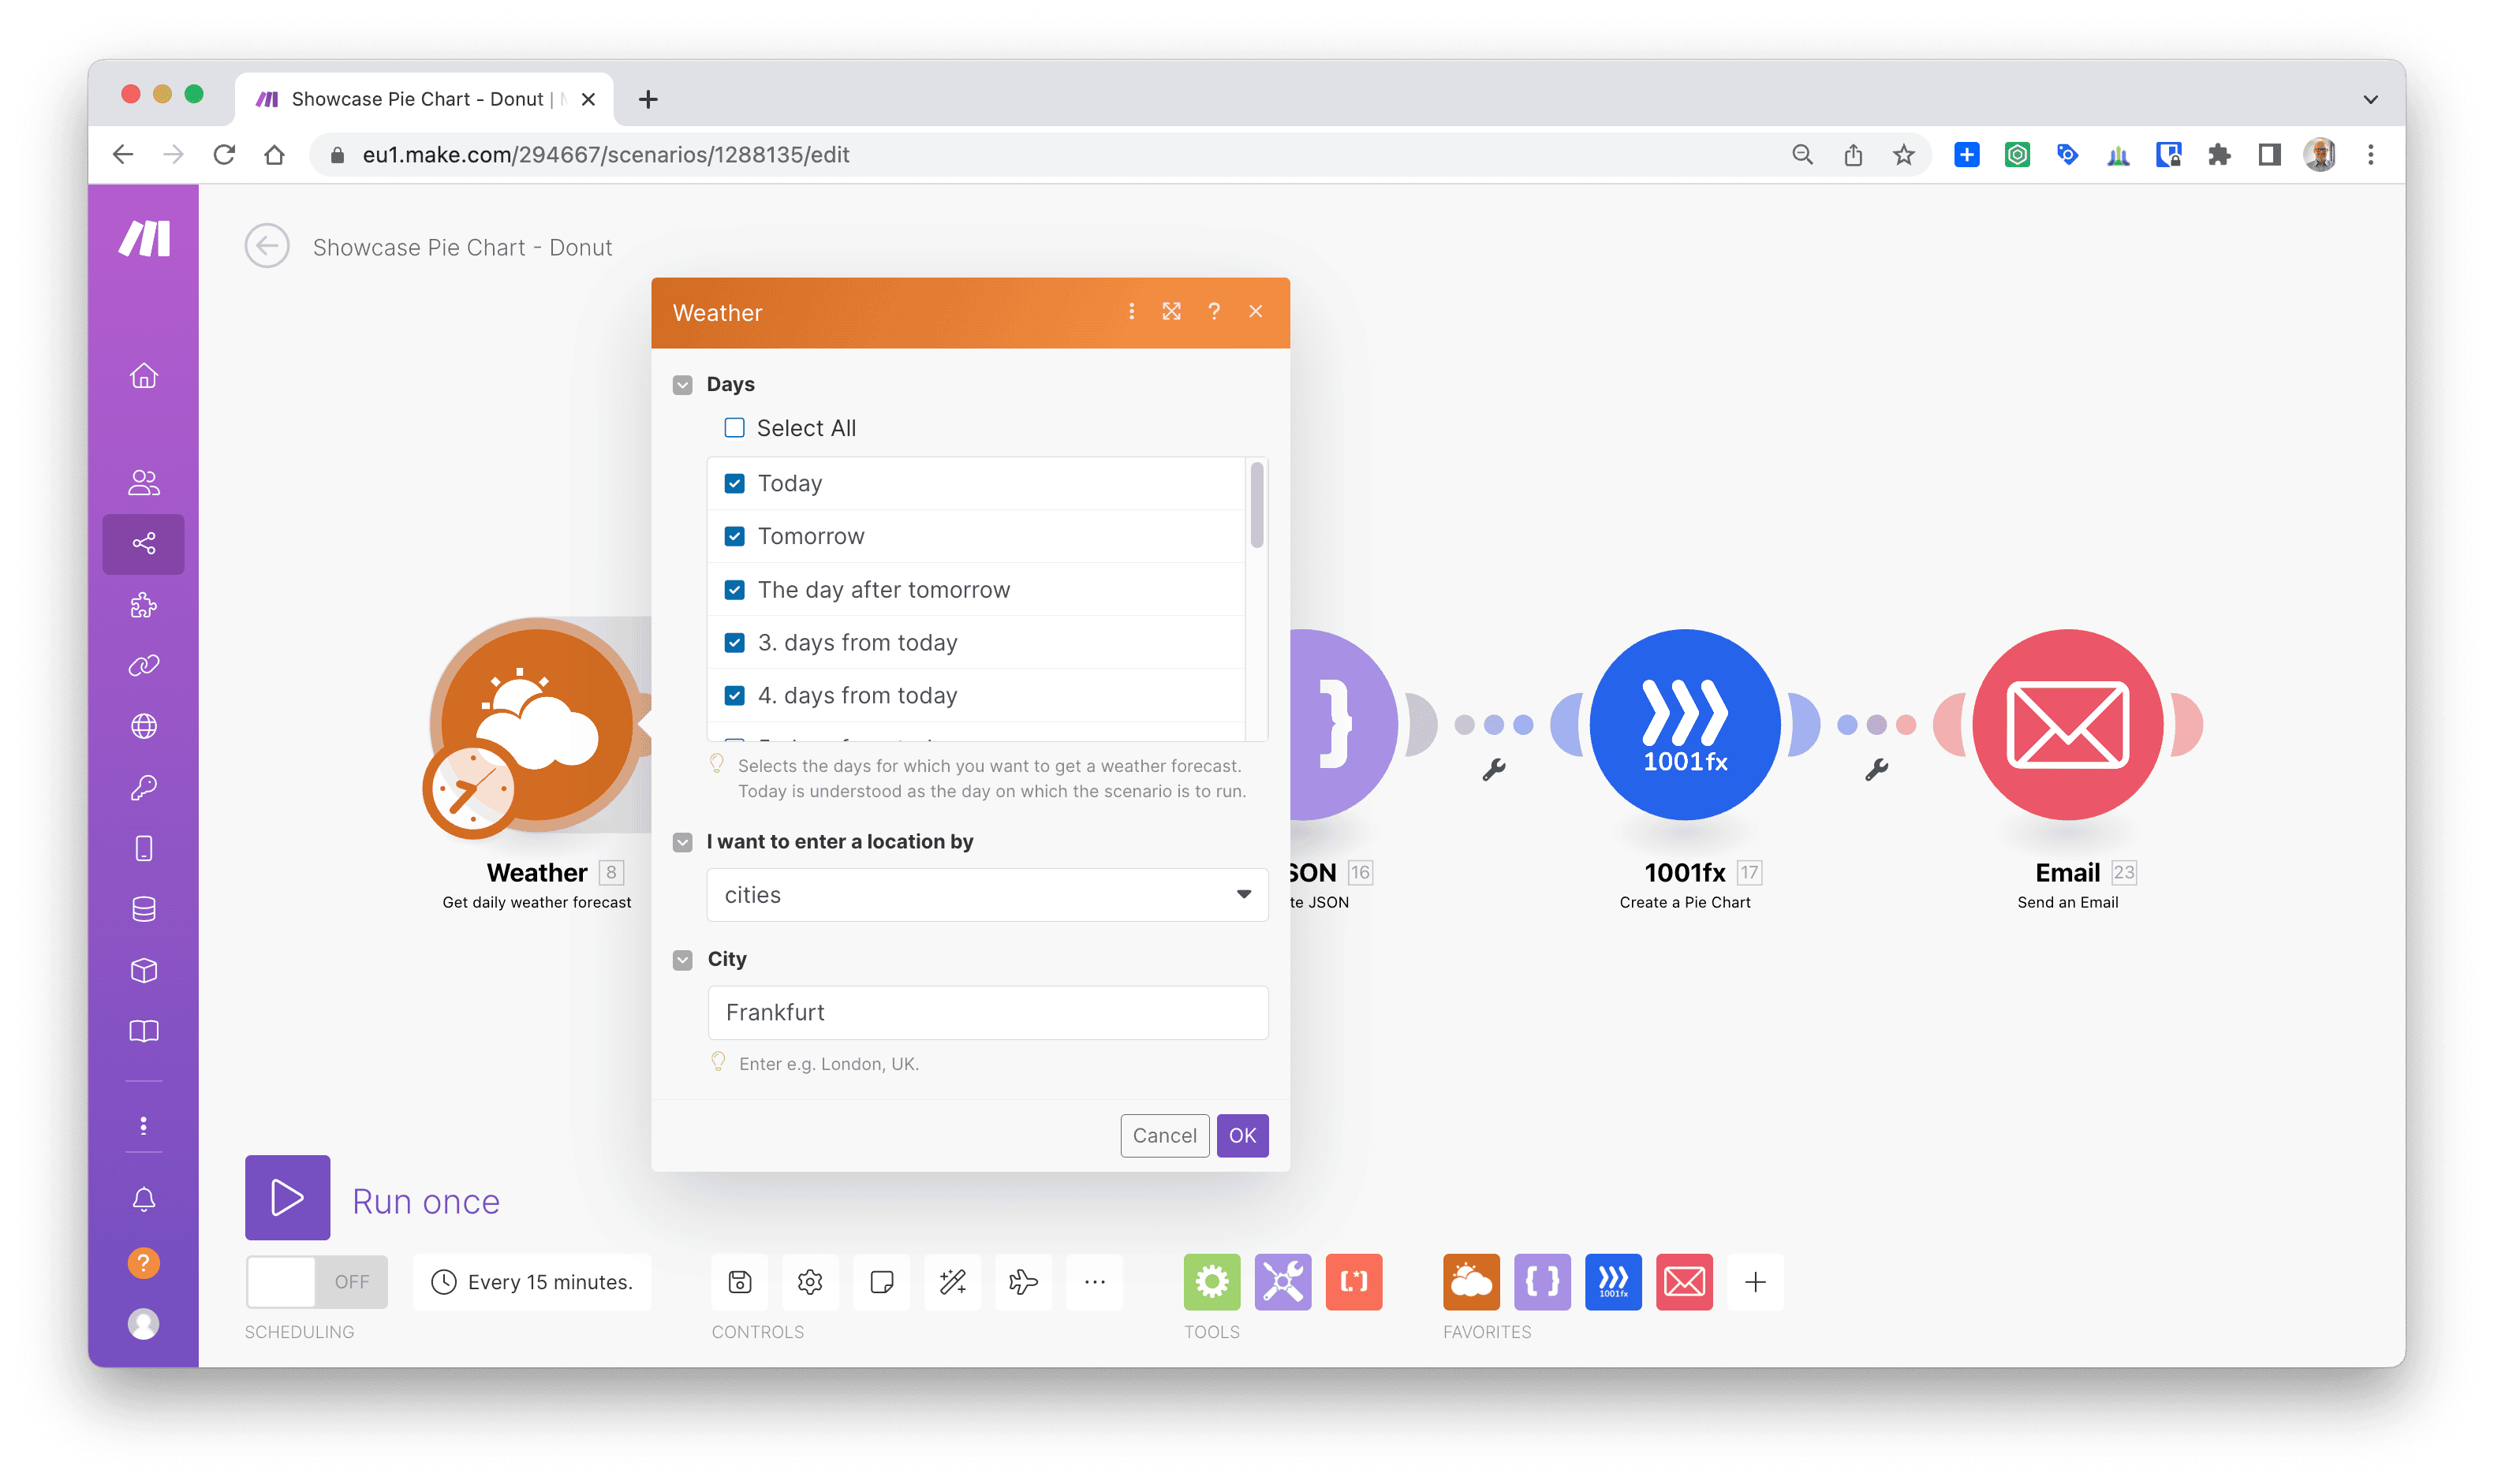
The data source we use is the Weather API. It could of course be any other data source.
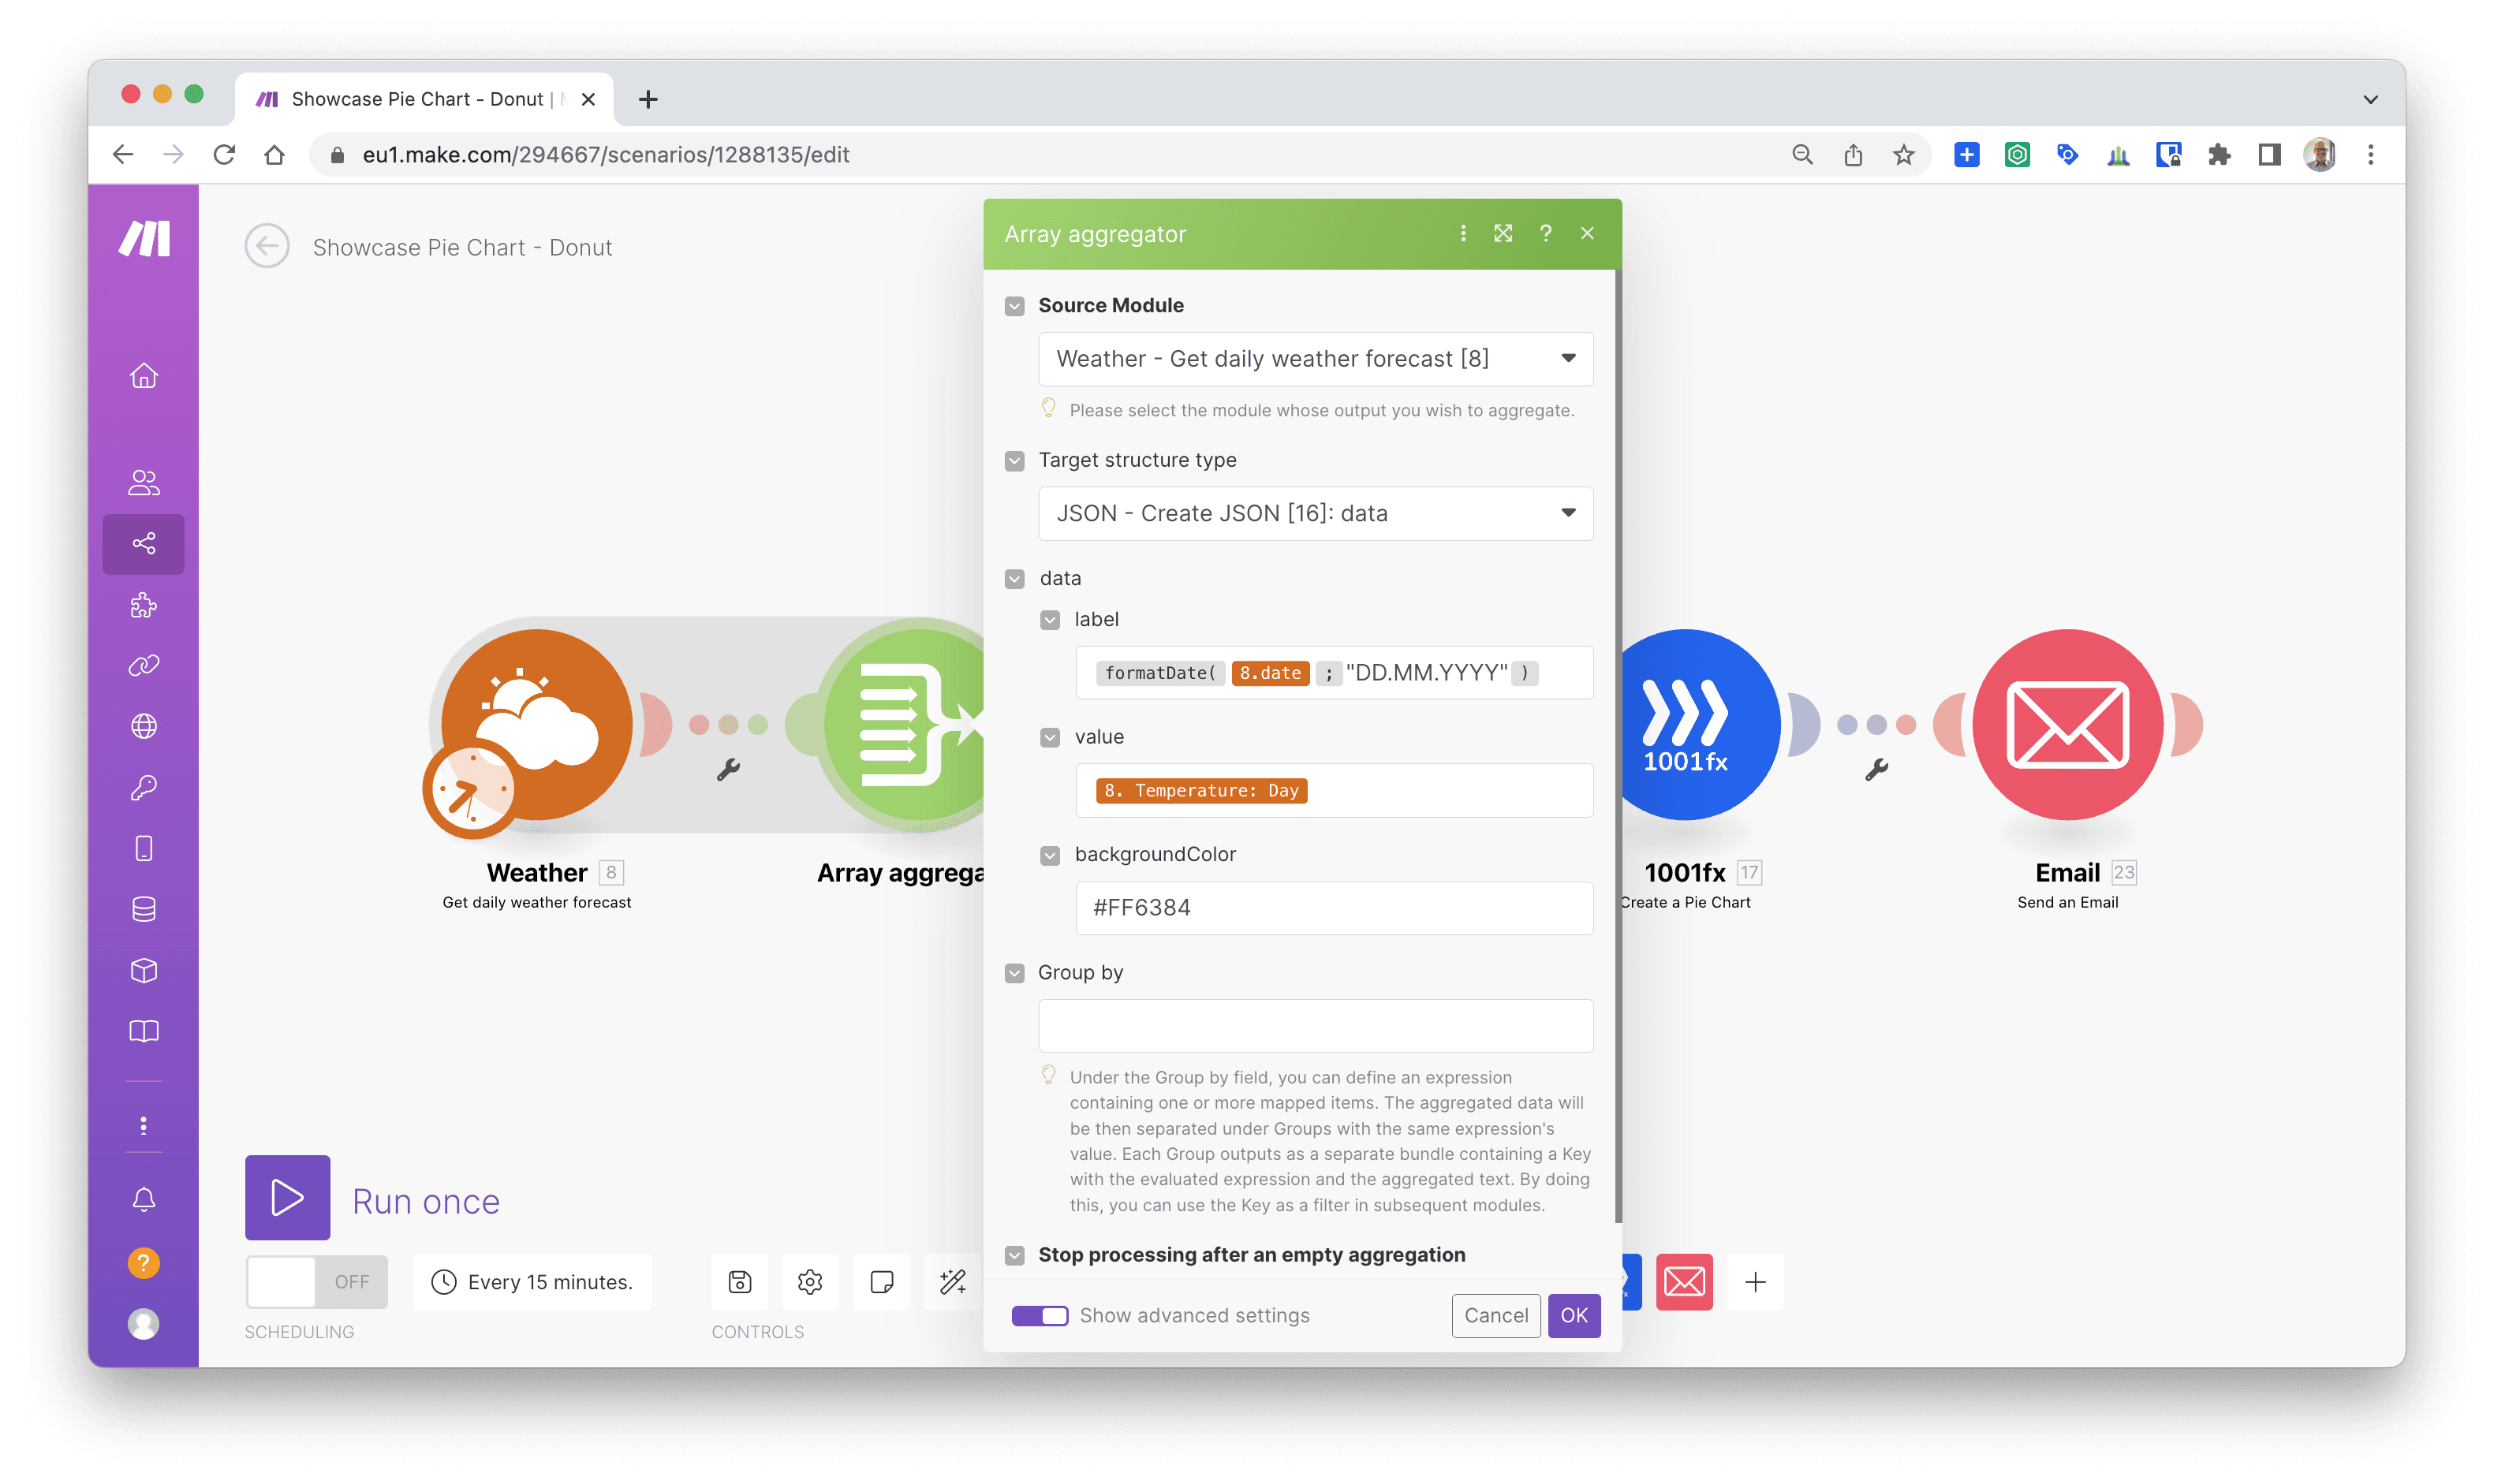
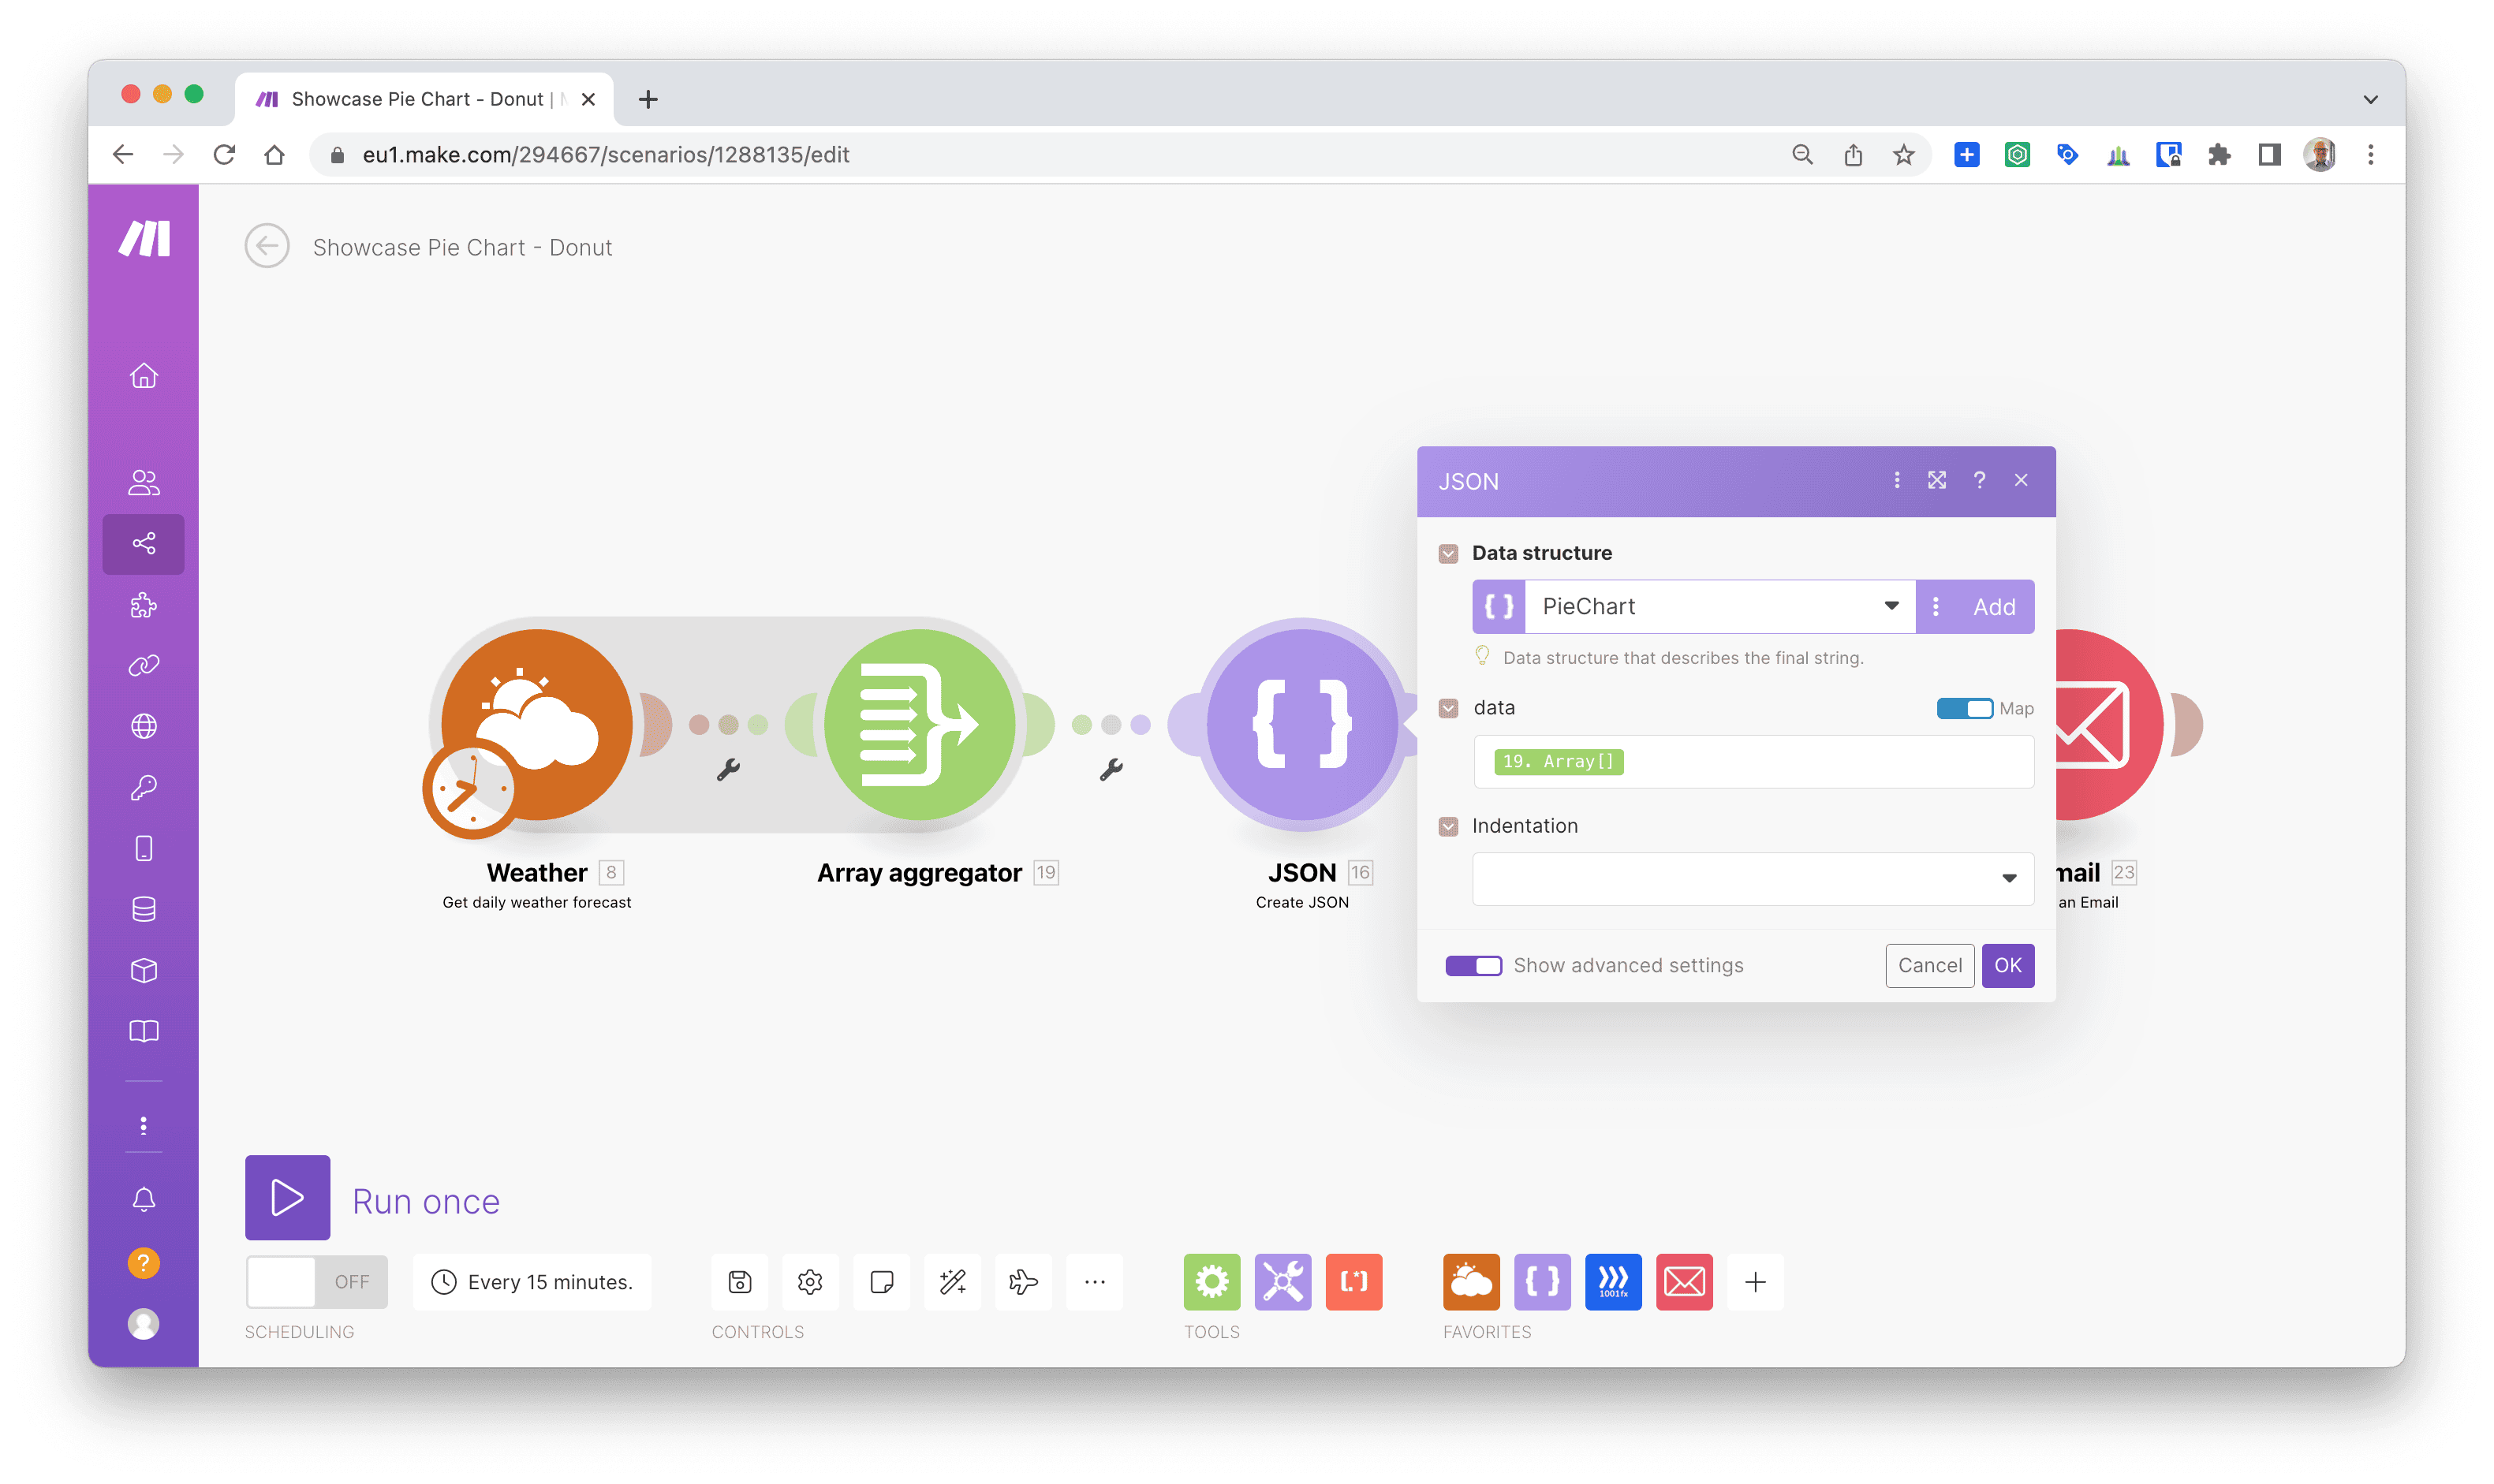
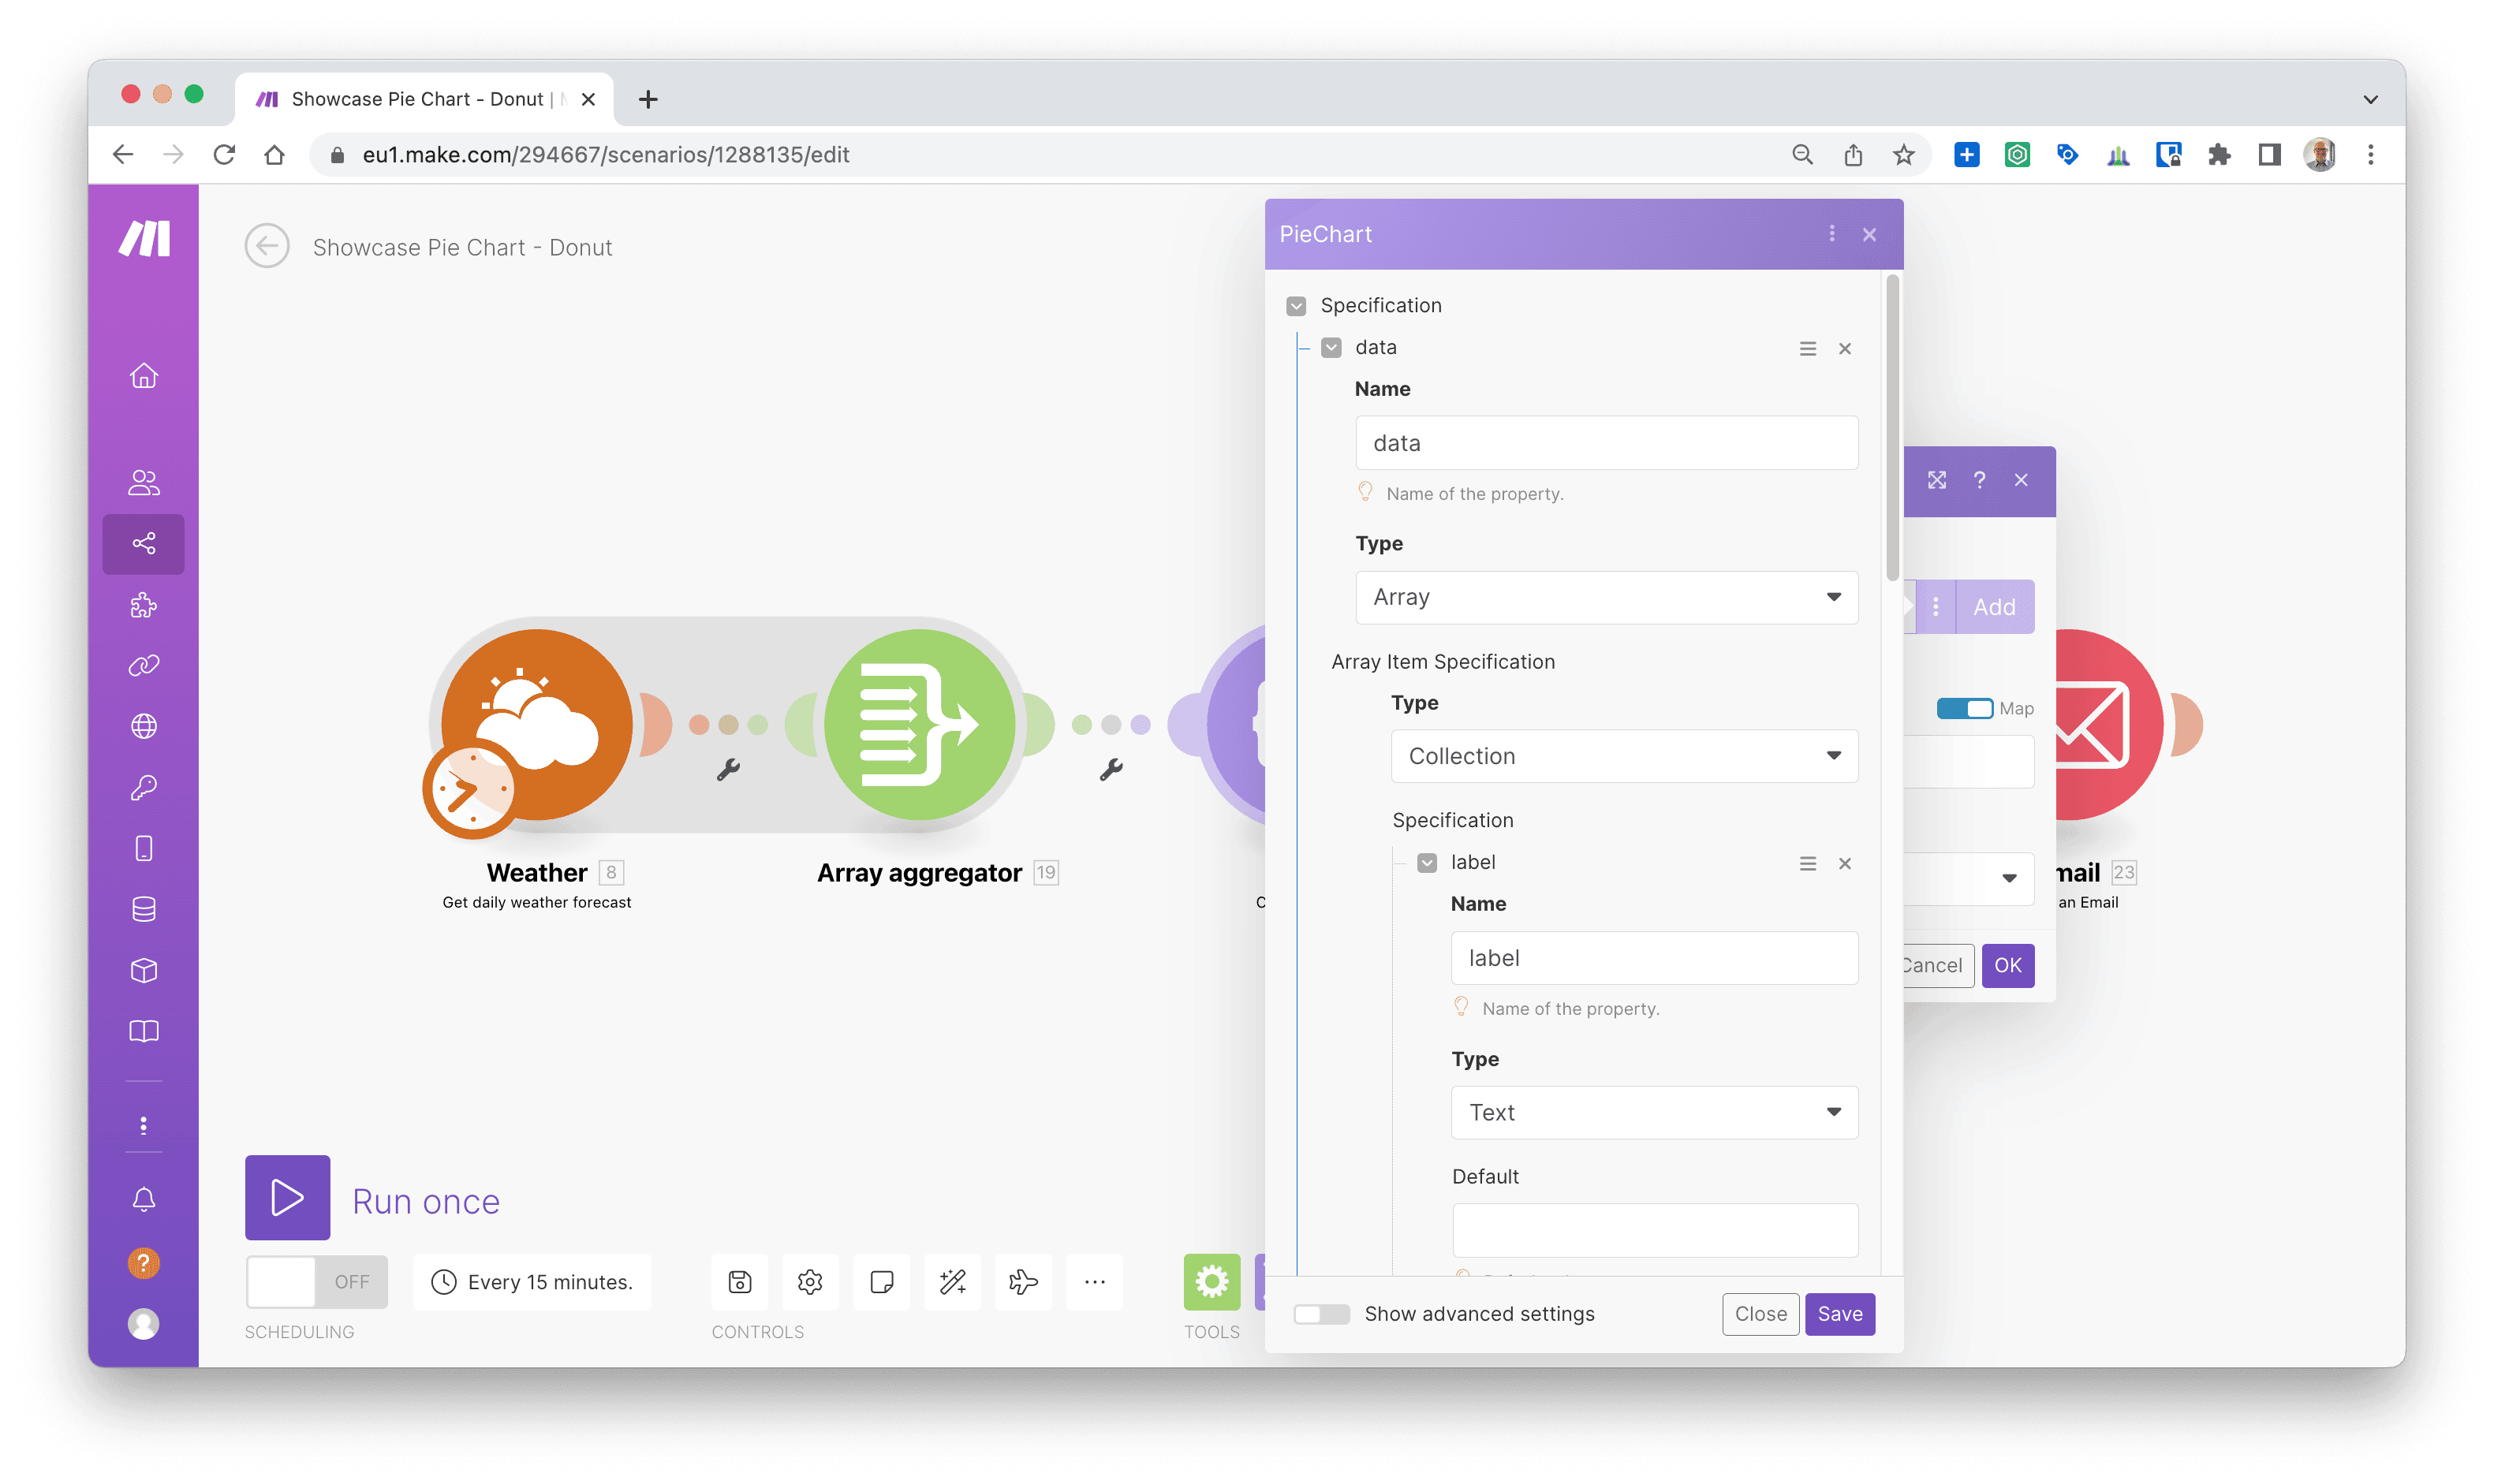
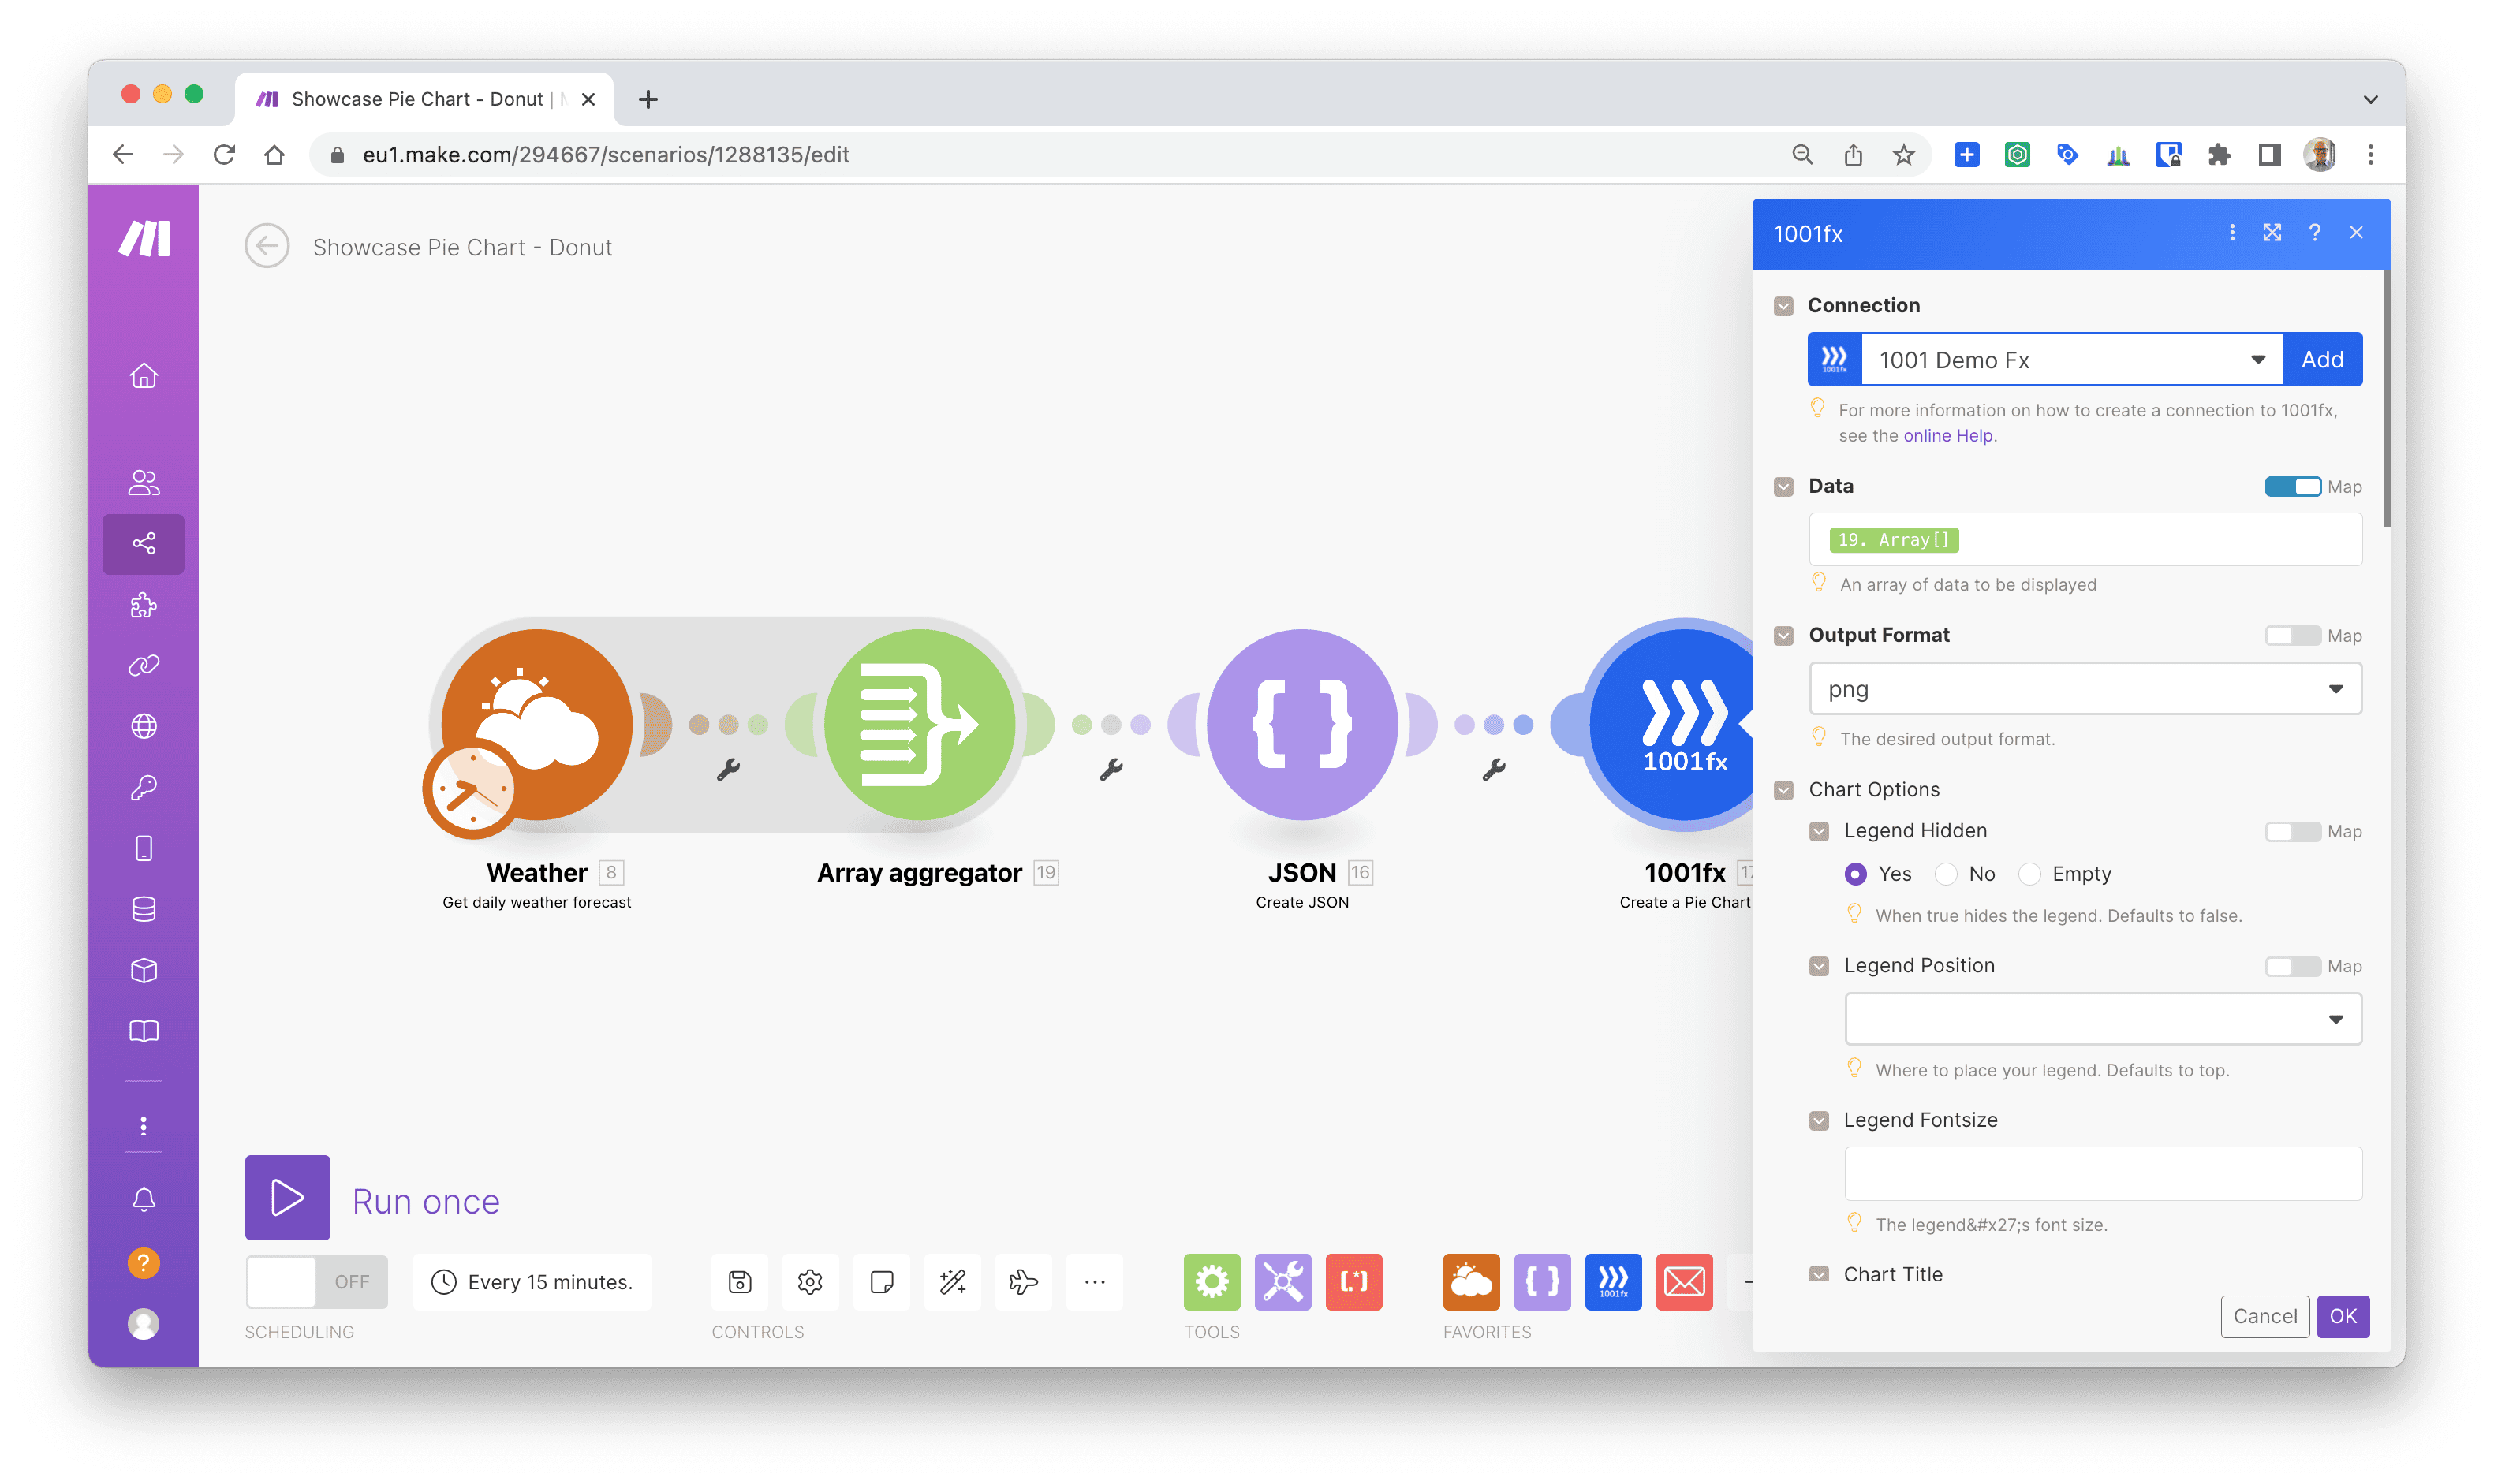
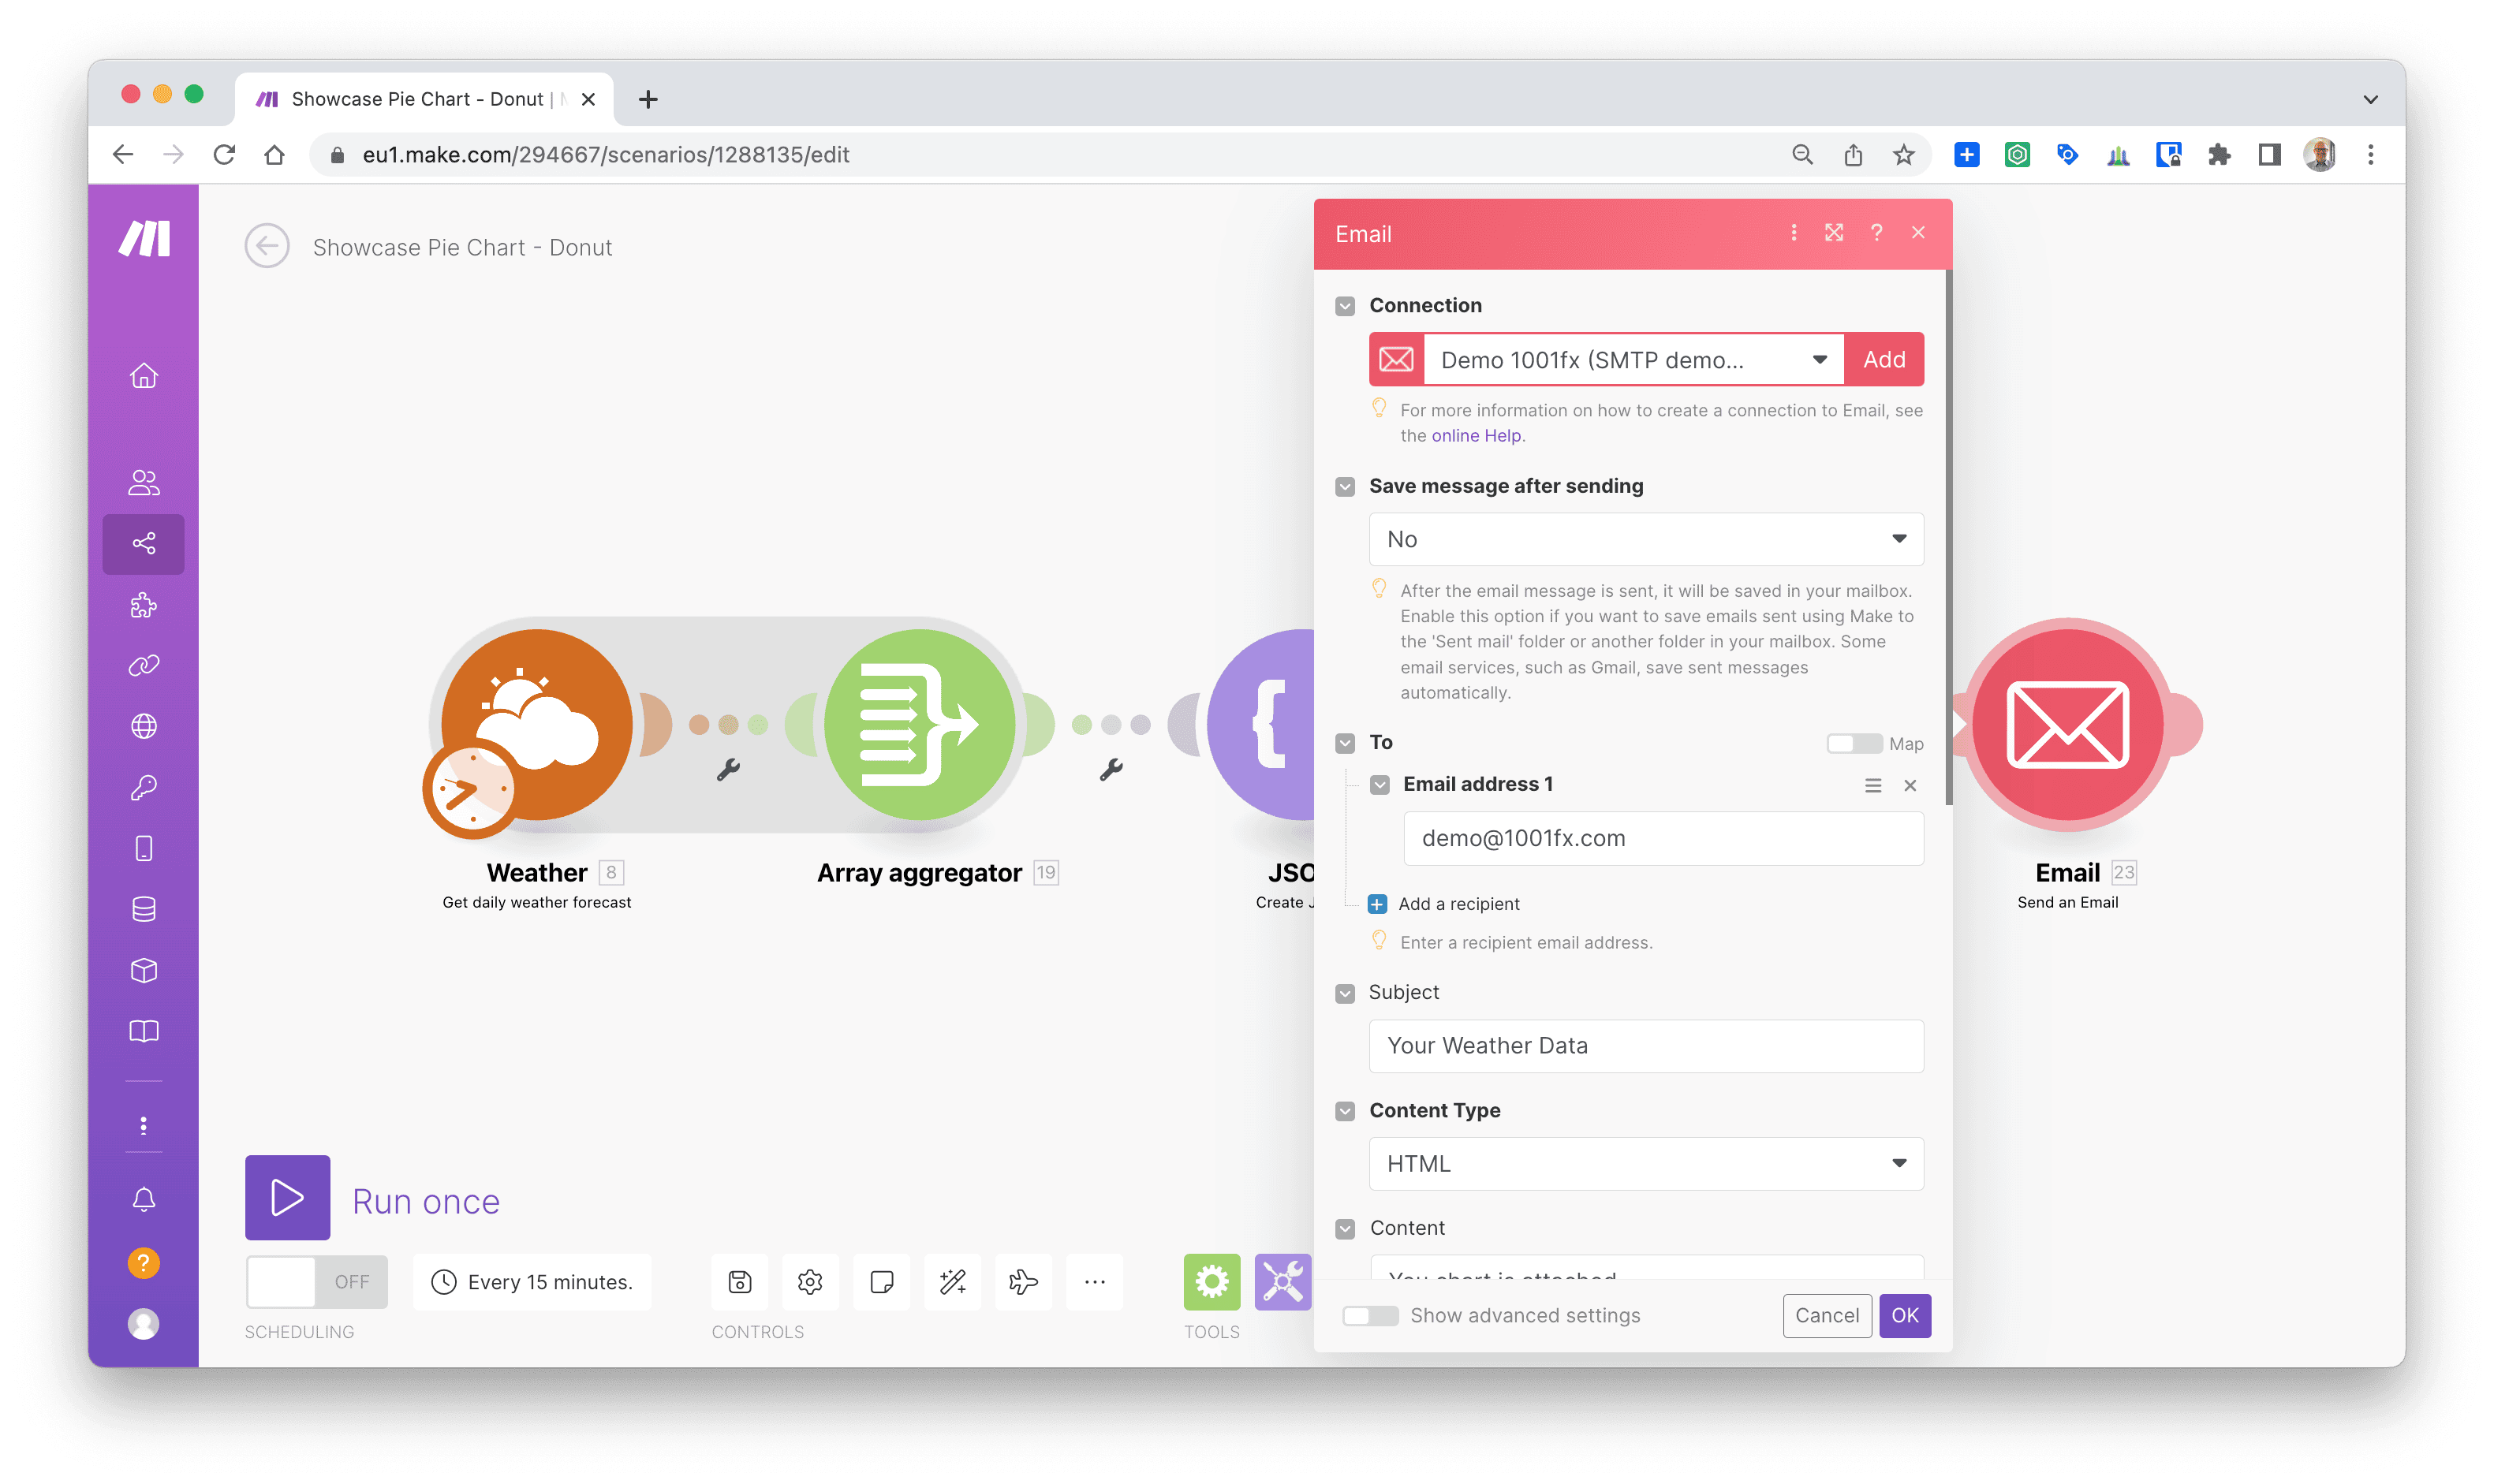
The data we get from the Weather API connector is aggregated and transformed into a data json that our function needs to render the charts. Additional display options such as titles, colours and sizes could be added. The image is added as an attachment.
Download the Make blueprints here: PieCharMakeBluepring.json
Postman & API
Please find below the details on using the library via POST or API.
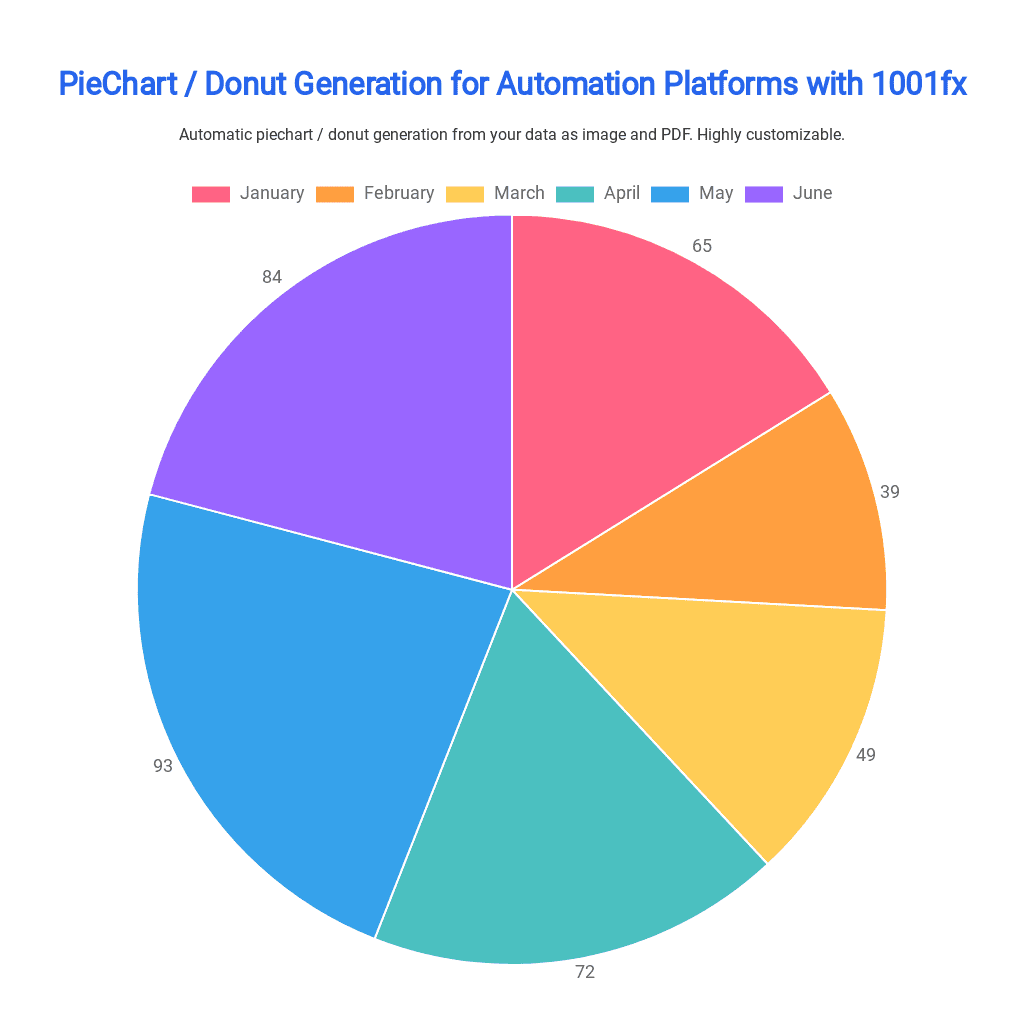
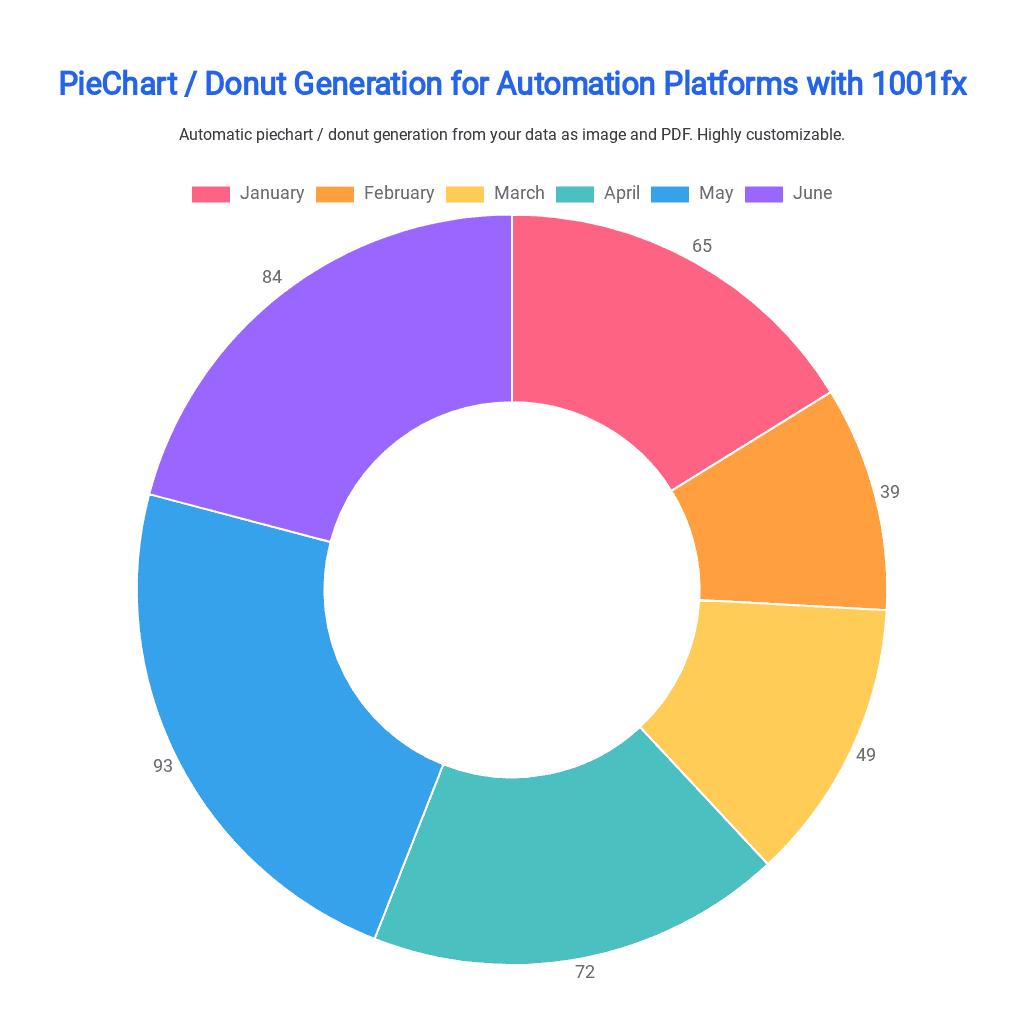
Pie Chart & Donut Chart
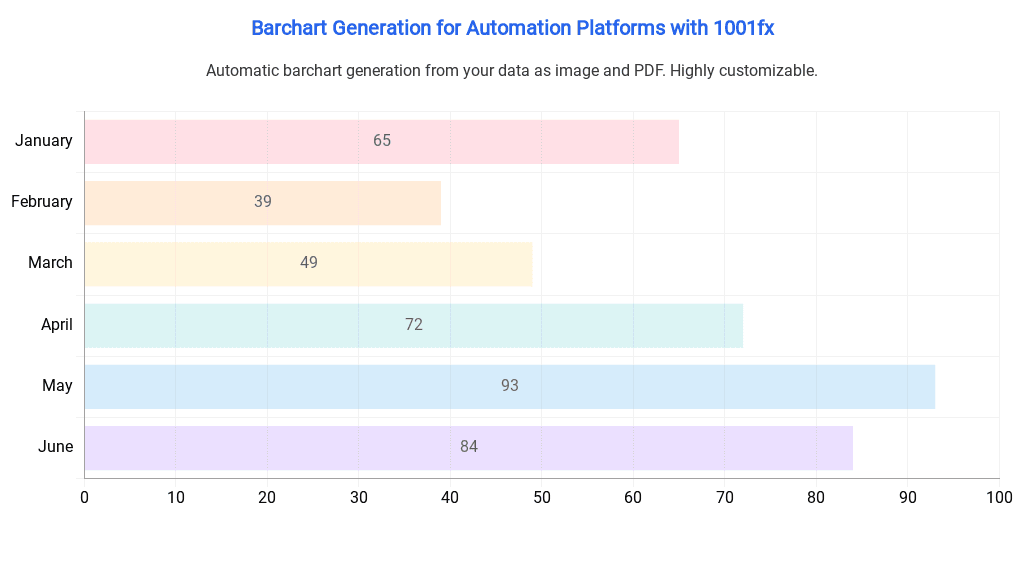
Bar Chart
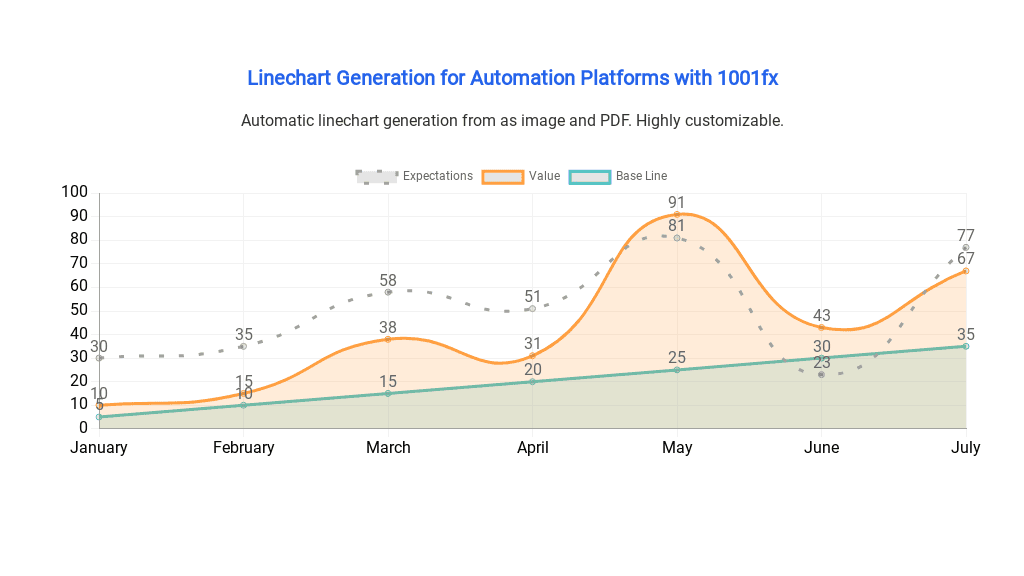
Line Chart
Make Scenario Screenshots