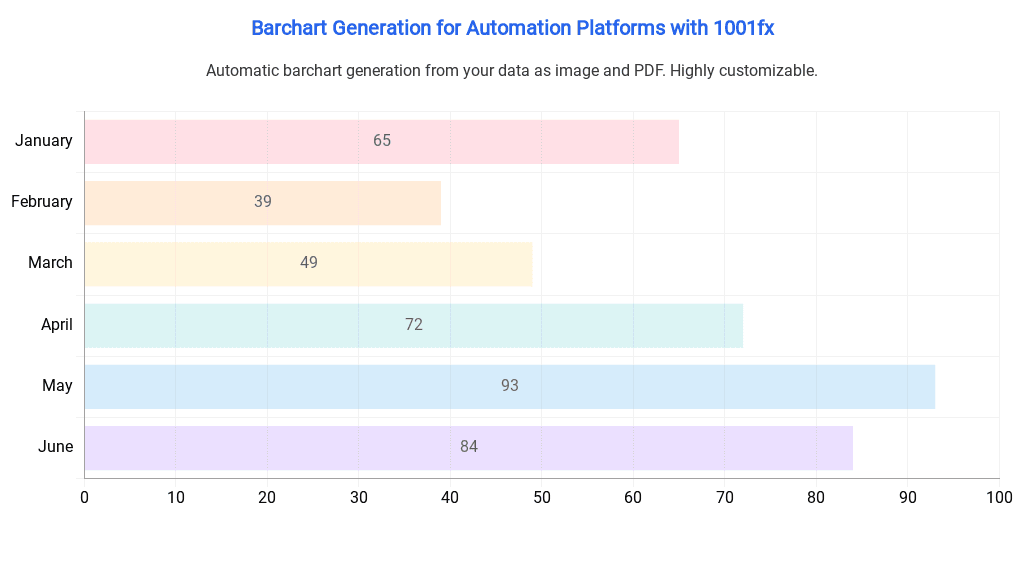
barchart - Create a Bar Chart

Creates a bar chart with custom data and styling. Output can be an image or a PDF.
To add the chart as an attachment in an email, you can generate the chart as an image or PDF using the function and then attach the resulting file to your email. You can also embed it by generating a base64 image based on using the function files/asset2base64

Sample output:

barchart.png

Here are some examples of when to use the function to create a chart as an image:

  • Presenting financial data: Use a barchart to represent data such as revenue or expenses over time. Customize the chart to show the necessary data and style.
  • Sales data: Use a barchart to represent sales data, such as sales by region, product, or customer. Use different colors for each bar to make the chart easier to read.
  • Survey results: Use a barchart to represent survey results, such as the percentage of people who agree or disagree with a statement. Use the dataLabelAlignment property to show the exact percentage for each bar.
  • Comparison of data: Use a barchart to compare data points, such as the performance of two products or the attendance of two events. Use the indexAxis property to create either vertical or horizontal bars depending on the data you are comparing.

The function is built on the Chart.js library, which is an open-source JavaScript library that allows developers to create interactive and customizable charts for web applications. Chart.js offers a variety of chart types, including bar charts, line charts, pie charts, and more, and provides extensive options for styling and customization.

You can find more information about Chart.js on their homepage: https://www.chartjs.org/

data
Type
array<object>
Required
required
An array of data to be displayed
Minimum: 1
Example:
[
  {
    "label": "January",
    "value": 65,
    "backgroundColor": "#FF638433",
    "borderColor": "#FF6384"
  },
  {
    "label": "February",
    "value": 39,
    "backgroundColor": "#FF9F4033",
    "borderColor": "#FF9F40"
  },
  {
    "label": "March",
    "value": 49,
    "backgroundColor": "#FFCD5633",
    "borderColor": "#FFCD56"
  },
  {
    "label": "April",
    "value": 72,
    "backgroundColor": "#4BC0C033",
    "borderColor": "#4BC0C0"
  },
  {
    "label": "May",
    "value": 93,
    "backgroundColor": "#36A2EB33",
    "borderColor": "#36A2EB"
  },
  {
    "label": "June",
    "value": 84,
    "backgroundColor": "#9966FF33",
    "borderColor": "#9966FF"
  }
]
backgroundColor
Type
HEX Color
The background color of your bar. Defaults to #000000 if no color is provided.
Example:
#FF9F4033
borderColor
Type
HEX Color
The border color of your bar. Defaults to #000000 if no color is provided.
Example:
#FF9F40
label
Type
string
Required
required
The text to associate with your value
Example:
January
value
Type
number
Required
required
The value of your entry
Example:
100
options
Type
object
Options to customize your chart.
Example:
{
  "title": "Barchart Generation for Automation Platforms with 1001fx",
  "titleAlignment": "center",
  "titleColor": "#2563EB",
  "subtitle": "Automatic barchart generation from your data as image and PDF. Highly customizable.",
  "subtitleAlignment": "center",
  "subtitleColor": "#333333",
  "gridColor": "#f2f2f2",
  "fontFamily": "Roboto",
  "titleFontSize": 20,
  "subtitleFontSize": 16,
  "axisTitleFontSize": 16,
  "axisFontSize": 16,
  "padding": 0,
  "dataLabelAnchor": "center",
  "dataLabelAlignment": "center",
  "dataLabelFontSize": 16,
  "indexAxis": "y"
}
borderWidth
Type
number
The border width of your bars. Defaults to 0.
Example:
1
borderRadius
Type
number
The border radius of your bars. Defaults to 0.
Example:
5
indexAxis
Type
string
The base axis. x for vertical bars. y for horizontal bars. Defaults to x.
Possible values are: x, y
Example:
y
title
Type
string
The title to be displayed above your chart.
Example:
Anual Report
titleAlignment
Type
string
Where to place your chart title. Defaults to center.
Possible values are: start, center, end
Example:
left
titleColor
Type
HEX Color
The title's color. Defaults to #000000 if no color is provided.
Example:
#36A2EB
titleFontSize
Type
number
The title's font size.
Example:
18
subtitle
Type
string
The subtitle to be displayed above your chart.
Example:
Anual Report
subtitleAlignment
Type
string
Where to place your chart subtitle. Defaults to center.
Possible values are: start, center, end
Example:
left
subtitleColor
Type
HEX Color
The subtitle's color. Defaults to #000000 if no color is provided.
Example:
#4BC0C0
subtitleFontSize
Type
number
The subtitleFontSize's font size.
Example:
18
backgroundColor
Type
HEX Color
The chart's backgroundColor. Defaults to #ffffff if no color is provided.
Example:
#FFCD56
padding
Type
number
The padding around your chart. Defaults to 50.
Example:
25
fontFamily
Type
string
The font to use in your chart.
Possible values are: Alegreya, Barlow, Inter, Lato, Montserrat, OpenSans, Oswald, Poppins, PTSans, Raleway, Roboto
Example:
Roboto
dataLabelAnchor
Type
string
Anchor position of your element. Defaults to center.
Possible values are: start, center, end
Example:
start
dataLabelAlignment
Type
string
Defines the position of the label relative to the anchor point. Defaults to center.
Possible values are: start, center, end, left, top, right, bottom
Example:
top
dataLabelFontSize
Type
number
The data label's font size
Example:
10
dataLabelOffset
Type
number
Offset from the anchor point. Defaults to 0.
Example:
10
dataLabelsHidden
Type
boolean
When true hides all data labels. Defaults to false.
Example:
dataLabelClamp
Type
boolean
When true enforces the anchor position to be calculated based on the visible geometry of the associated element. Defaults to false.
Example:
yAxisTitle
Type
string
Text to be displayed on the y axis.
Example:
Month
xAxisTitle
Type
string
Text to be displayed on the x axis.
Example:
Value
axisTitleFontSize
Type
number
The axis title's font size.
Example:
18
axisTitleColor
Type
HEX Color
The axis title's color. Defaults to #000000 if no color is provided.
Example:
#4BC0C0
gridColor
Type
HEX Color
The grid's color. Defaults to #f2f2f2 if no color is provided. Hide by setting to same as chart background color.
Example:
#4BC0C0
axisColor
Type
HEX Color
The grid's color. Defaults to #a0a0a0 if no color is provided. Hide by setting to same as chart background color.
Example:
#9966FF
axisFontSize
Type
number
The axis's font size.
Example:
18
outputFormat
Type
string
Required
required
The desired output format.
Possible values are: pdf, png, jpg
Example:
png

Available on

Postman
Make
Zapier
N8N
Airtable
SeaTable
Bubble
Power Automate
Workato
SAP Build