
piechart - Create a Pie Chart
Creates a pie chart with custom data and styling. Output can be an image or a PDF.
A pie chart is a type of chart that displays data as a circle divided into segments, with each segment representing a proportion of the whole. It is useful for showing how a particular data set is divided into parts and how each part contributes to the whole. For example, a pie chart can be used to show the percentage breakdown of sales by product category in a business. The size of each segment is determined by the value it represents in relation to the other segments, with the whole circle representing 100%. Pie charts are commonly used in business, finance, and other fields to help visualize data in an easily understandable way.
Sample output:
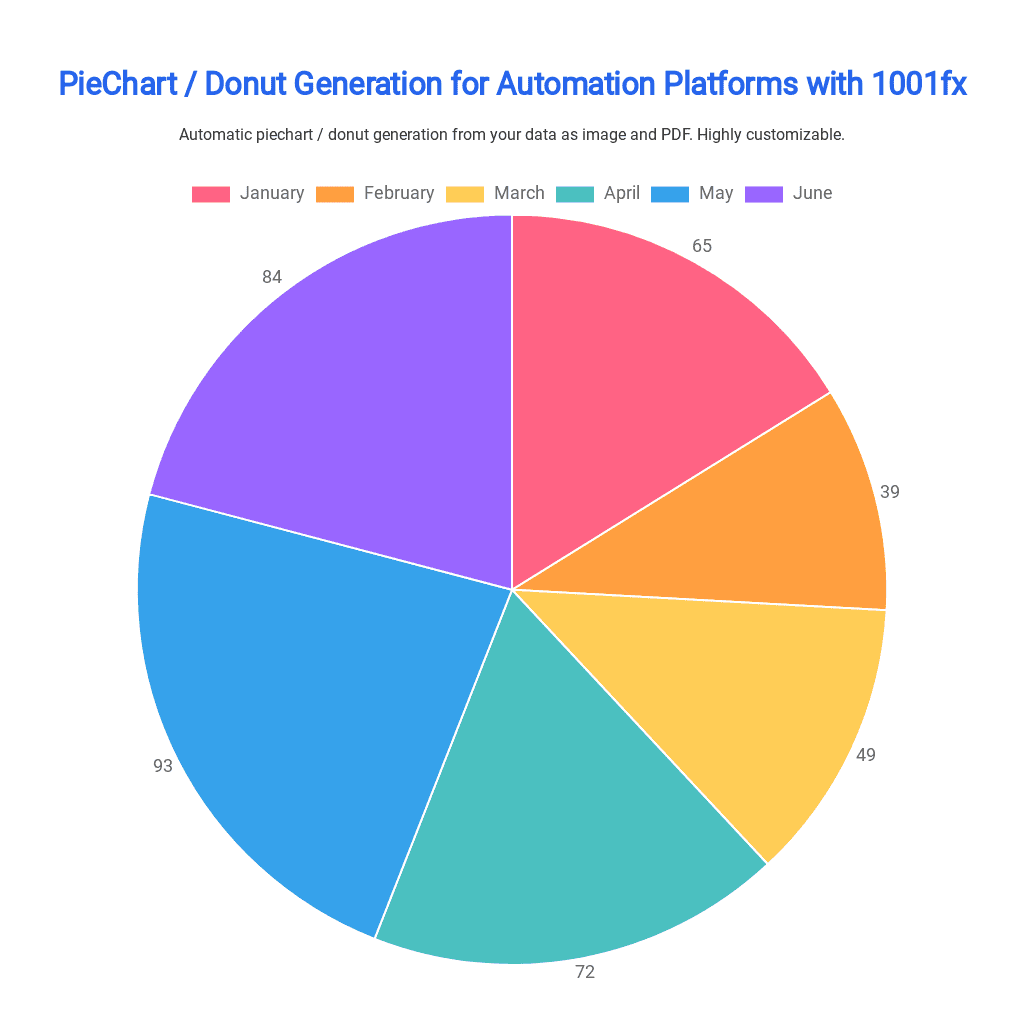
Set type=pie
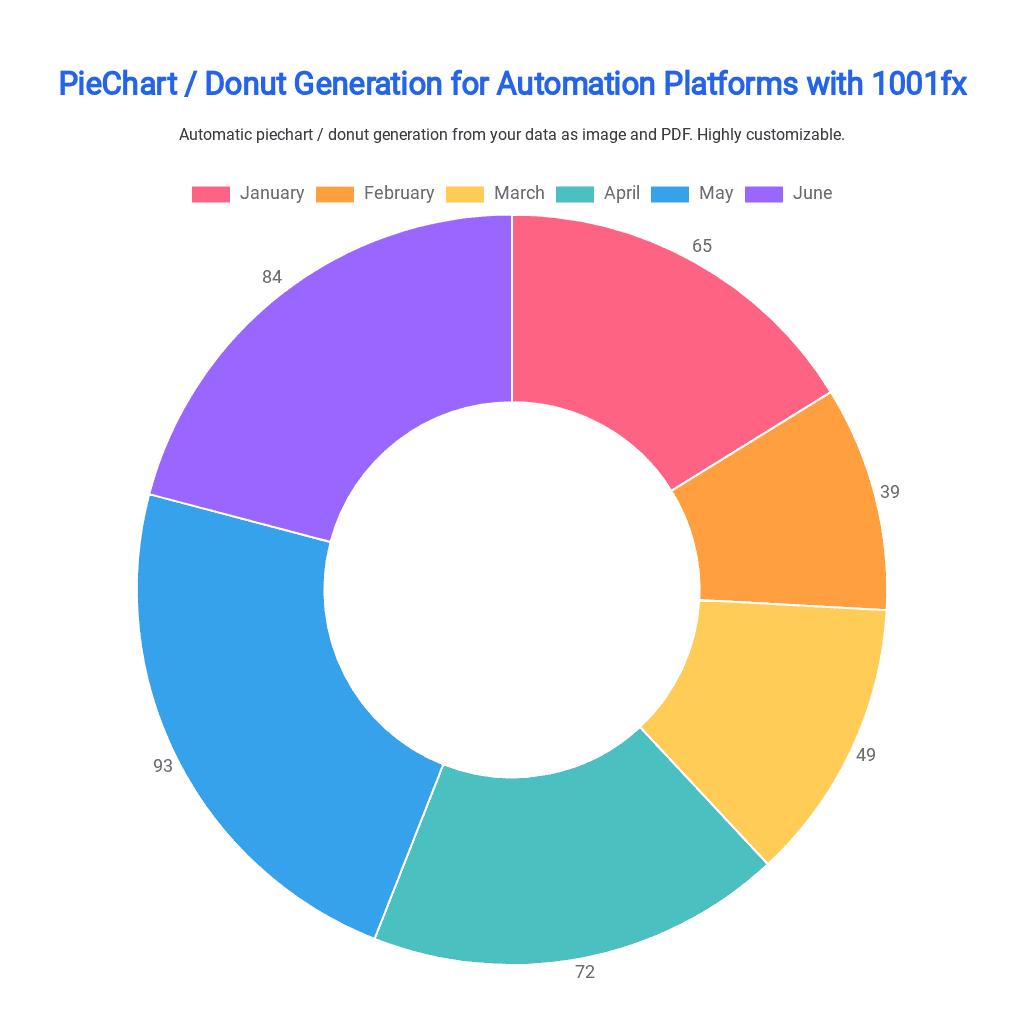
Set type=donut
To add the chart as an attachment in an email, you can generate the chart as an image or PDF using the function and then attach the resulting file to your email. You can also embed it by generating a base64 image based on using the function files/asset2base64
The function is built on the Chart.js library, which is an open-source JavaScript library that allows developers to create interactive and customizable charts for web applications. Chart.js offers a variety of chart types, including bar charts, line charts, pie charts, and more, and provides extensive options for styling and customization.
You can find more information about Chart.js on their homepage: https://www.chartjs.org/
data[
{
"label": "January",
"value": 65,
"backgroundColor": "#FF6384"
},
{
"label": "February",
"value": 39,
"backgroundColor": "#FF9F40"
},
{
"label": "March",
"value": 49,
"backgroundColor": "#FFCD56"
},
{
"label": "April",
"value": 72,
"backgroundColor": "#4BC0C0"
},
{
"label": "May",
"value": 93,
"backgroundColor": "#36A2EB"
},
{
"label": "June",
"value": 84,
"backgroundColor": "#9966FF"
}
]backgroundColor#FF9F4033labelJanuaryvalue100options{
"title": "PieChart / Donut Generation for Automation Platforms with 1001fx",
"titleAlignment": "center",
"titleColor": "#2563EB",
"subtitle": "Automatic piechart / donut generation from your data as image and PDF. Highly customizable.",
"subtitleAlignment": "center",
"subtitleColor": "#333333",
"fontFamily": "Roboto",
"titleFontSize": 32,
"subtitleFontSize": 16,
"dataLabelAnchor": "end",
"dataLabelAlignment": "end",
"dataLabelFontSize": 18,
"legendPosition": "top",
"legendFontSize": 18
}legendHiddenlegendPositionbottomlegendFontSize18titleAnual ReporttitleAlignmentlefttitleColor#36A2EBtitleFontSize18subtitleAnual ReportsubtitleAlignmentleftsubtitleColor#4BC0C0subtitleFontSize18backgroundColor#FFCD56padding25fontFamilyRobotodataLabelAnchorstartdataLabelAlignmenttopdataLabelFontSize10dataLabelOffset10dataLabelsHiddendataLabelClamptypepieoutputFormatpng