- App
- Make
- n8n
How to create a pie chart image
To create a pie chart, send your labels and values to the 1001fx function piechart – from Make, n8n or the 1001fx app. It renders the chart as PNG, JPG or PDF, as a pie or a donut, with your own colors, title and legend.
The fields
The same in the 1001fx app, Make and n8n. piechart costs 3 credits per call.
- data
- – The collected list: label and value per slice, optionally backgroundColor as a hex color.
- outputFormat
- – png or jpg for an image, pdf for a document.
- type
- – pie (default) or donut.
- options
- – Optional title, subtitle, colors, font sizes and legend position.
All parameters and examples: piechart reference.
Example
What you send to piechart and what comes back – the same in every tool.
Pie chart as PDF
Custom title, subtitle and colours; returns a PDF.
Input
{
  "type": "pie",
  "data": [
    {
      "label": "January",
      "value": 65,
      "backgroundColor": "#FF6384"
    },
    {
      "label": "February",
      "value": 39,
      "backgroundColor": "#FF9F40"
    },
    {
      "label": "March",
      "value": 49,
      "backgroundColor": "#FFCD56"
    },
    {
      "label": "April",
      "value": 72,
      "backgroundColor": "#4BC0C0"
    },
    {
      "label": "May",
      "value": 93,
      "backgroundColor": "#36A2EB"
    },
    {
      "label": "June",
      "value": 84,
      "backgroundColor": "#9966FF"
    }
  ],
  "options": {
    "title": "PieChart / Donut Generation for Automation Platforms with 1001fx",
    "titleAlignment": "center",
    "titleColor": "#2563EB",
    "subtitle": "Automatic piechart / donut generation from your data as image and PDF. Highly customizable.",
    "subtitleAlignment": "center",
    "subtitleColor": "#333333",
    "fontFamily": "Roboto",
    "titleFontSize": 32,
    "subtitleFontSize": 16,
    "dataLabelAnchor": "end",
    "dataLabelAlignment": "end",
    "dataLabelFontSize": 18,
    "legendPosition": "top",
    "legendFontSize": 18
  },
  "outputFormat": "pdf"
}Output · HTTP 200
{
  "statusCode": 200,
  "headers": {
    "content-type": "application/pdf",
    "content-disposition": "attachment; filename=\"result.pdf\""
  }
}Show curl command
curl -X POST 'https://api.1001fx.com/charts/piechart' \
  -H 'X-API-KEY: YOURSECRETAPIKEY' \
  -H 'Content-Type: application/json' \
-d '{"type":"pie","data":[{"label":"January","value":65,"backgroundColor":"#FF6384"},{"label":"February","value":39,"backgroundColor":"#FF9F40"},{"label":"March","value":49,"backgroundColor":"#FFCD56"},{"label":"April","value":72,"backgroundColor":"#4BC0C0"},{"label":"May","value":93,"backgroundColor":"#36A2EB"},{"label":"June","value":84,"backgroundColor":"#9966FF"}],"options":{"title":"PieChart / Donut Generation for Automation Platforms with 1001fx","titleAlignment":"center","titleColor":"#2563EB","subtitle":"Automatic piechart / donut generation from your data as image and PDF. Highly customizable.","subtitleAlignment":"center","subtitleColor":"#333333","fontFamily":"Roboto","titleFontSize":32,"subtitleFontSize":16,"dataLabelAnchor":"end","dataLabelAlignment":"end","dataLabelFontSize":18,"legendPosition":"top","legendFontSize":18},"outputFormat":"pdf"}'In the 1001fx app
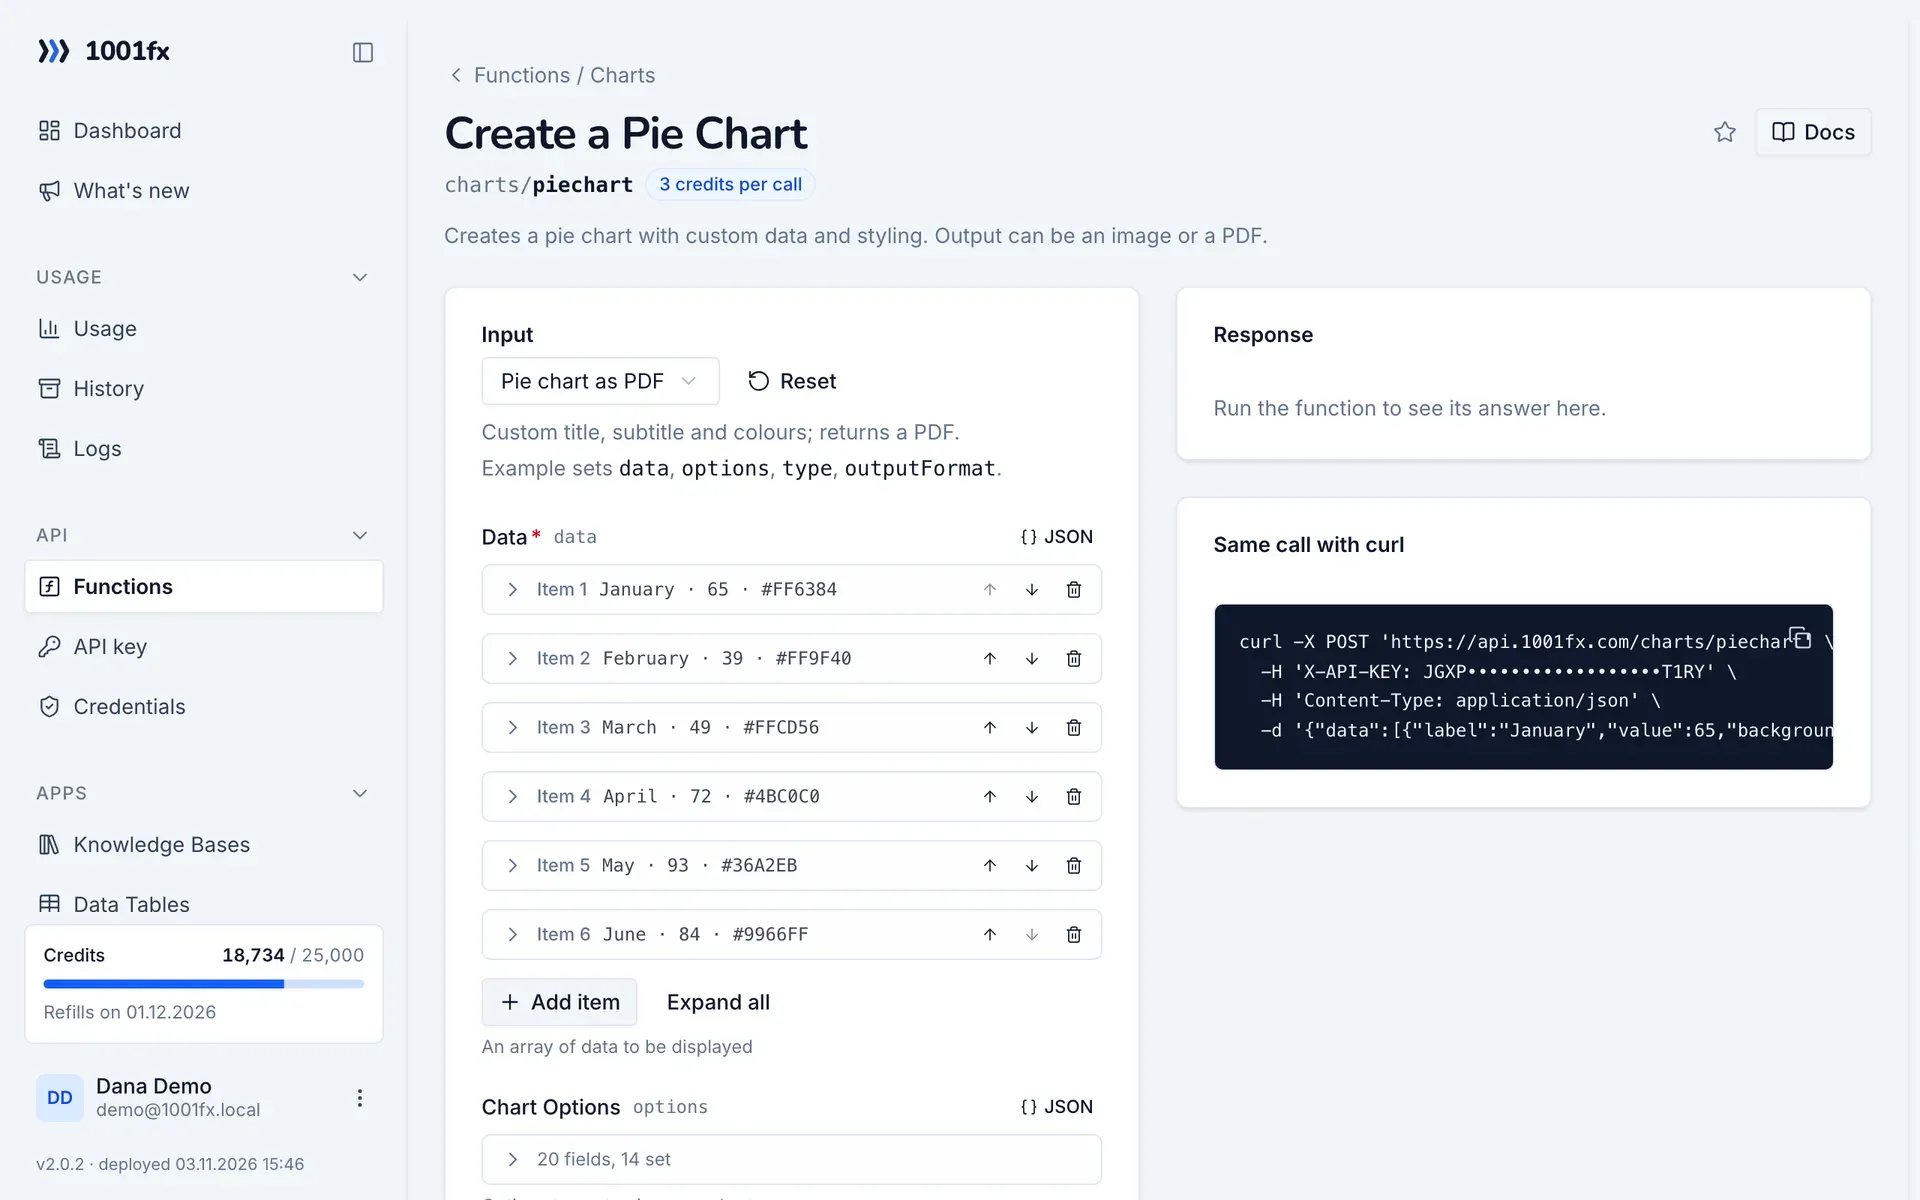
Without a scenario or workflow: run the function in your browser for a one-off task, or to try the fields before you build the automation.
- 1
Open the function
Log in to the 1001fx app and open Functions → Create a Pie Chart.
- 2
Fill the fields
Fill the fields as described above. Files can be uploaded from your computer.
- 3
Run it
Click Run. The answer appears next to the form; files come as a download. Each run is charged like an API call.
- 4
Reuse the call
The same page shows the call as cURL command, ready for scripts and other tools.
In Make
- 1
Start the scenario
Start with the data, for example a Google Sheets "Search rows" module followed by an Array aggregator that collects label and value of each row.
- 2
Add the 1001fx module
Add a module, search for 1001fx and pick “Create a Pie Chart”. Select your 1001fx connection or create one with your API key.
- 3
Fill the fields
Fill the fields as described above, mapped from the previous steps.
- 4
Use the result
The module returns the chart as a file. Attach it to an email, upload it to a shared folder or add it to a report.
Connecting 1001fx: 1001fx for Make.
In n8n
- 1
Start the workflow
Start with the data, for example a Google Sheets node that gets the rows, followed by an Aggregate node that collects label and value of each row into one list.
- 2
Add the 1001fx node
Add a node, search for 1001fx and pick “Create a Pie Chart”. Select your 1001fx credential or create one with your API key.
- 3
Fill the fields
Fill the fields as described above, mapped from the previous steps.
- 4
Use the result
The node returns the chart as a file. Attach it to a Send Email node, upload it with a Google Drive node or add it to a report.
Connecting 1001fx: 1001fx for n8n.
Tips
- Give every slice a backgroundColor, so the same category has the same color in every report.
- For values over time use linechart or barchart, which take the same kind of data.
Frequently asked questions
- Can I create a donut chart?
- Yes. Set type to donut; the data stays the same.
- Which output formats are available?
- PNG, JPG and PDF, chosen with outputFormat.